Previous | Close | Next
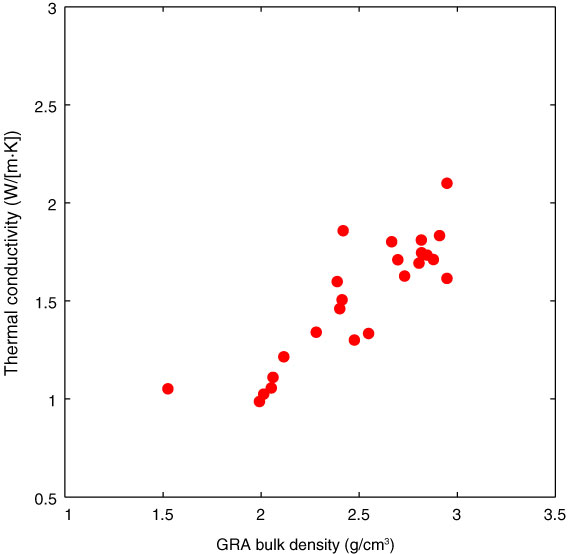
Figure F61. Plot of gamma ray attenuation (GRA) bulk density vs. thermal conductivity, Hole U1372A. Results show an approximately linear relationship.
Previous | Close | Next | Top of page