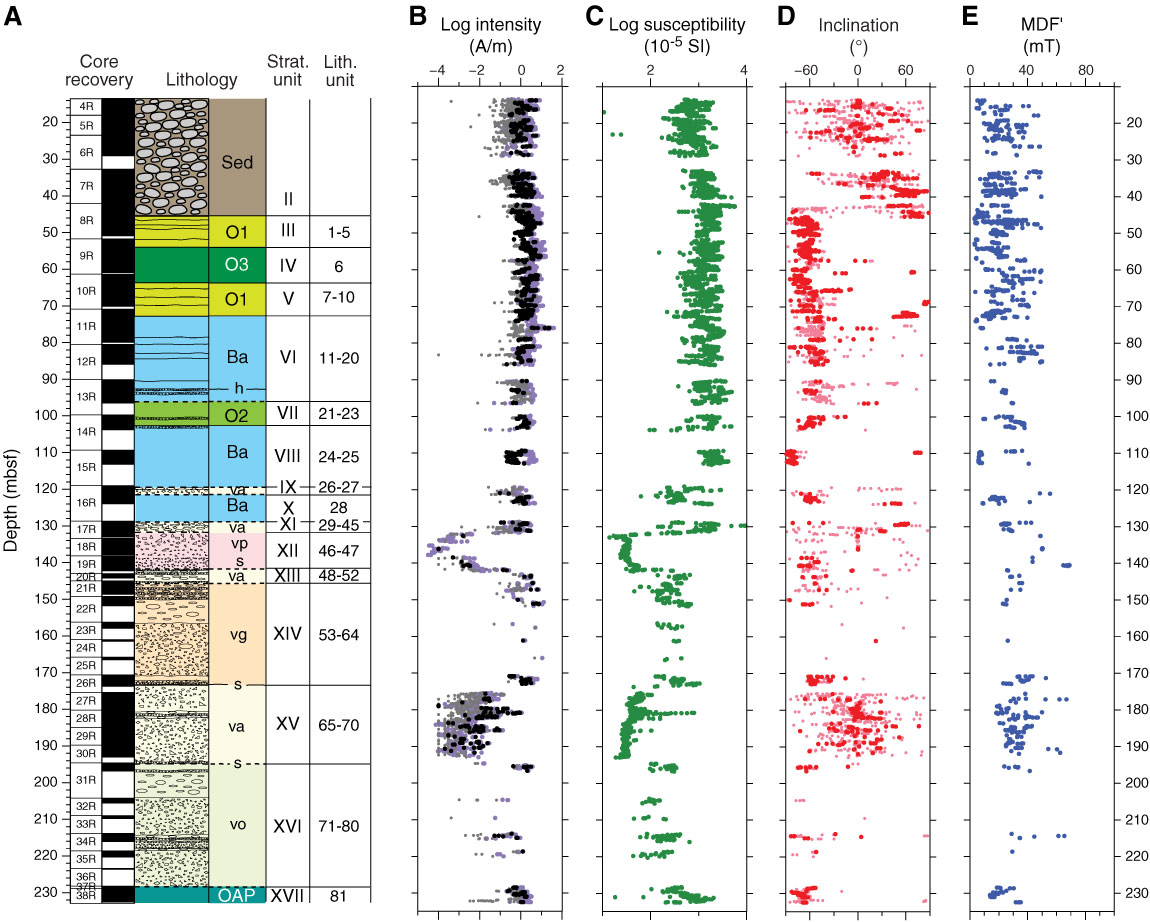
Figure F62. Downhole plots of paleomagnetic data from archive core halves, Hole U1372A. A. Core recovery and observed stratigraphy (see Figs. F4 and F18 for explanation of patterns and abbreviations). B. Intensity variations: purple = NRM intensities, black = intensities associated with PCA directions with misfits ≤ 3.40, gray = intensities associated with PCA directions with misfits > 3.40. C. WRMSL magnetic susceptibility (see “Physical properties”). D. Inclination: red = PCA directions with misfits ≤ 3.40, pink = PCA directions with misfits > 3.40. E. Median destructive field (MDF′) of vector difference sum (VDS) for PCA directions with misfits ≤ 3.40.
Previous | Close | Next | Top of page