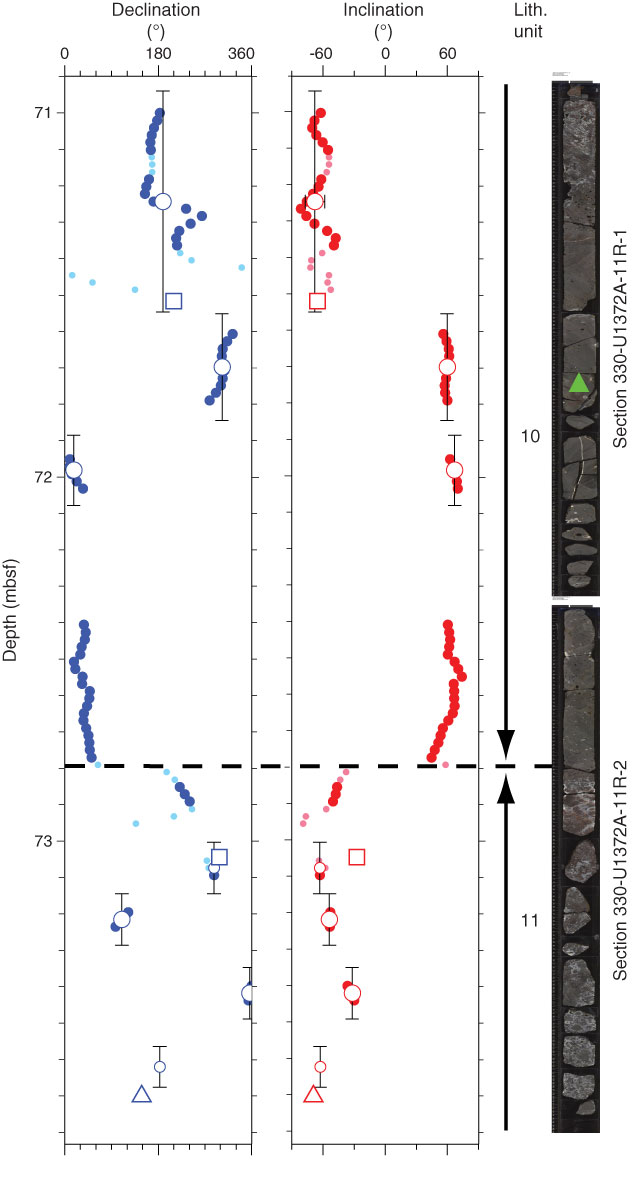
Figure F68. Plots of inclination and declination in reversed polarity interval, Sections 330-U1372A-11R-1 and 11R-2. Archive-half core data are indicated by filled circles (lighter color if misfit > 3.40). Open circles with error bars = piece-average directions from archive-half core. Open squares (triangles) = discrete sample thermal (AF) demagnetization results. Green triangle in core photographs shows location of discrete sample taken for AF demagnetization that did not yield a stable direction.

Previous | Close | Next | Top of page