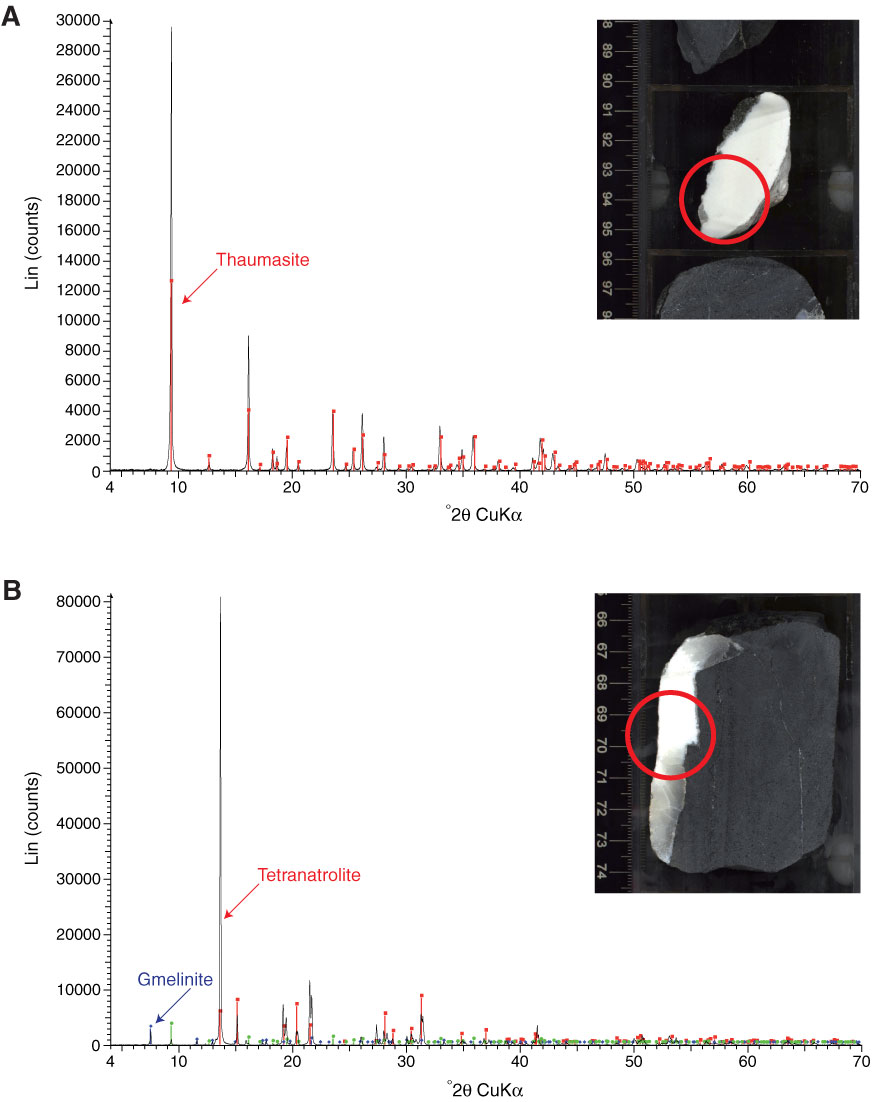
Figure F36. X-ray diffraction spectra and associated core photographs (analyzed zones are highlighted with red circles). A. Voids showing filling with thaumasite (Sample 330-U1374A-68R-5, 90–91 cm). B. Vein predominantly composed of tetranatrolite, gmelinite, and thaumasite (not labeled) (Sample 330-U1374A-68R-5, 73–74 cm).
Previous | Close | Next | Top of page