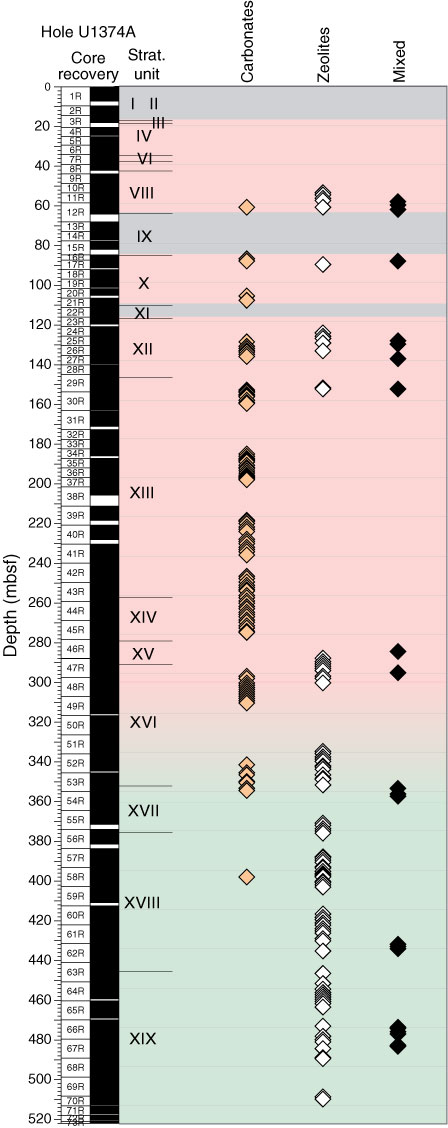
Figure F49. Plot of downhole distribution of void secondary minerals for each alteration interval defined by the alteration petrology group. Symbols are located at center depth for each interval. Note the predominance of carbonate in the uppermost ~300 mbsf, followed by the predominance of zeolite from ~300 mbsf to the bottom of the hole. Gray shading represents sedimentary units, pink and green shading represent basalts that were altered under oxidized and reduced conditions, respectively.
Previous | Close | Next | Top of page