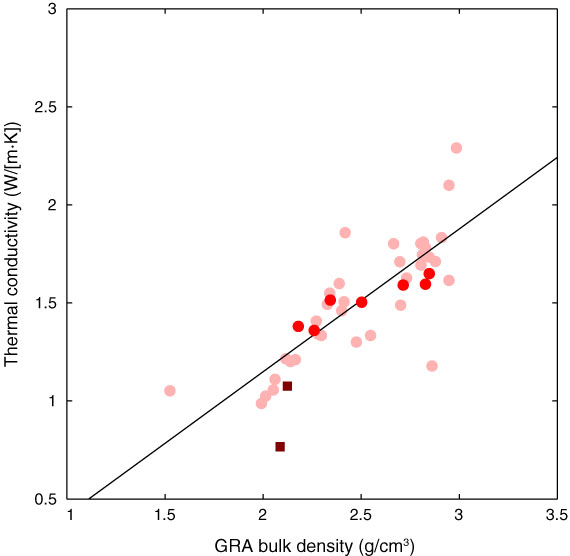
Figure F72. Plot of gamma ray attenuation (GRA) bulk density vs. thermal conductivity, Hole U1374A. Red = Hole U1374A, pink = Sites U1372 and U1373, black line = best robust linear fit to data from Sites U1372 and U1373. Squares = last two values from the damaged thermal probe in Hole U1374A; these values deviate significantly from the expected trend, demonstrating the unreliable nature of the values returned just before the thermal probe stopped working altogether.
Previous | Close | Next | Top of page