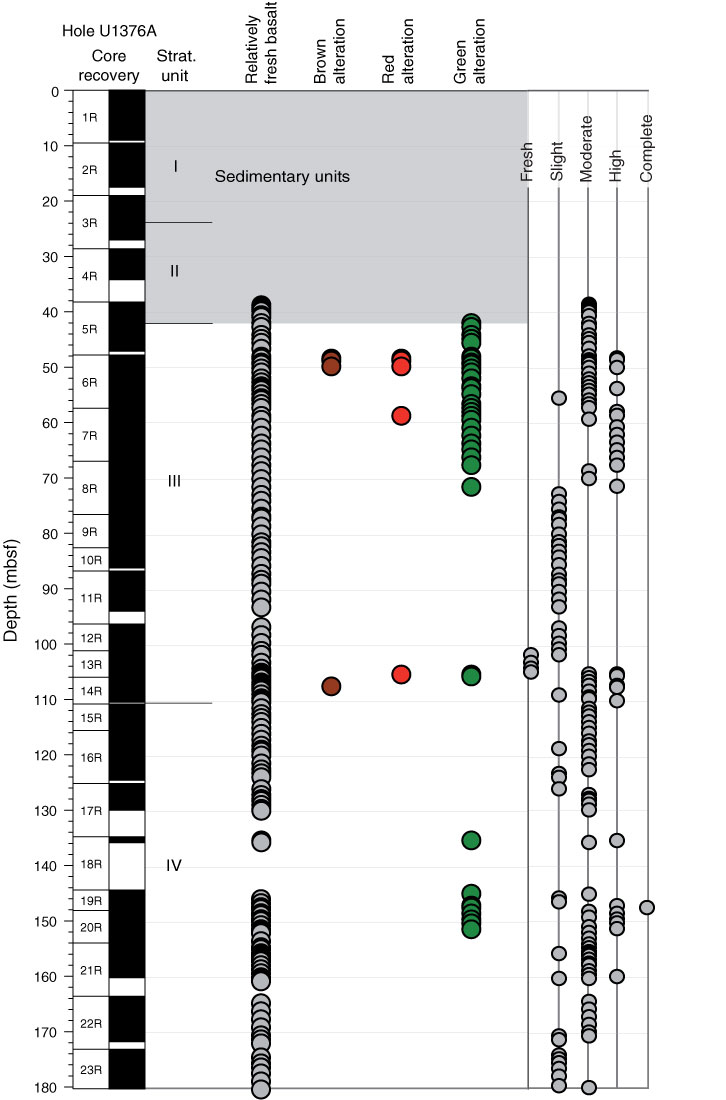
Figure F20. Plot of downhole distribution of alteration colors and groundmass alteration (from fresh to completely altered) for each alteration interval defined by the alteration petrology group. Circles are located at center depth for each interval. Gray shading represents sedimentary units.
Previous | Close | Next | Top of page