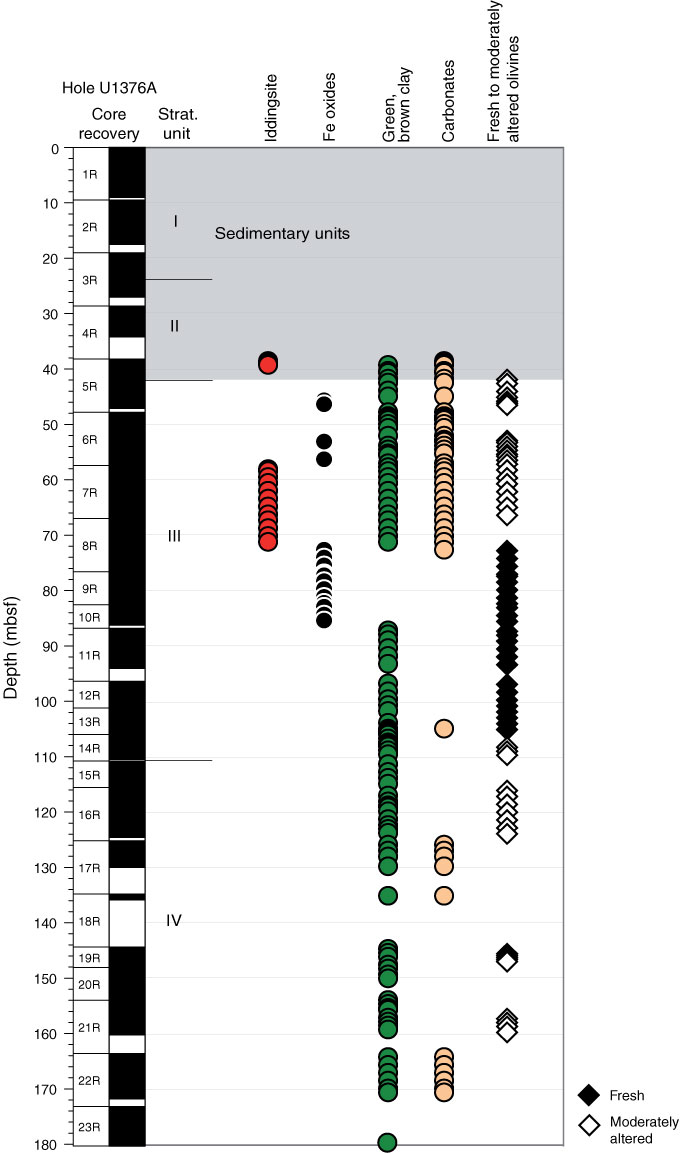
Figure F21. Plot of downhole distribution of secondary minerals after olivine for each alteration interval defined by the alteration petrology group. Symbols are located at center depth of each interval. Occurrence of fresh to moderately altered olivine is from macroscopic observations; for thin section observations, see Table T6. Gray shading represents sedimentary units.
Previous | Close | Next | Top of page