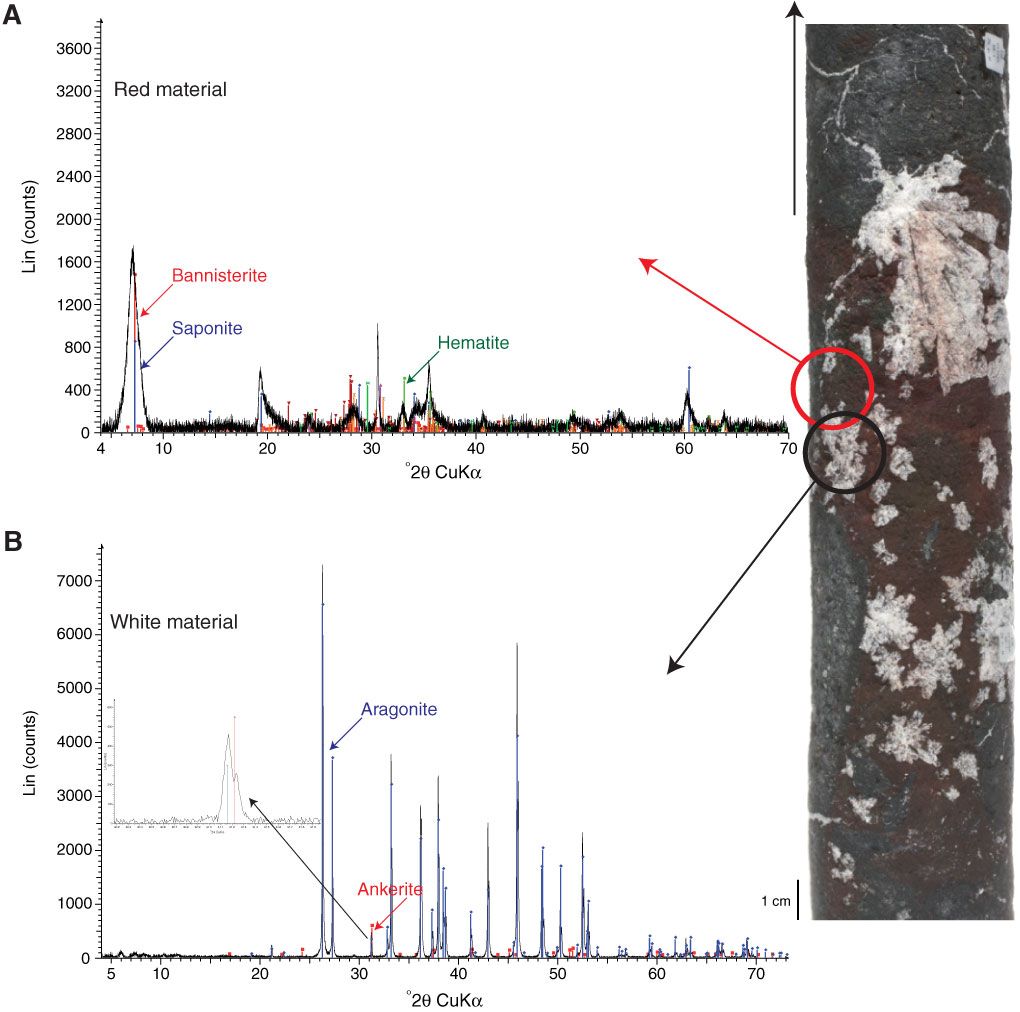
Figure F22. A, B. X-ray diffraction spectra and associated core photographs (analyzed zones are highlighted with red and black circles) (Sample 330-U1376A-6R-1, 96–98 cm). Red patches in the core are mainly composed of secondary hematite and clay minerals (bannisterite and saponite) with associated secondary aragonite and ankerite in the white, crystal-rich zones.
Previous | Close | Next | Top of page