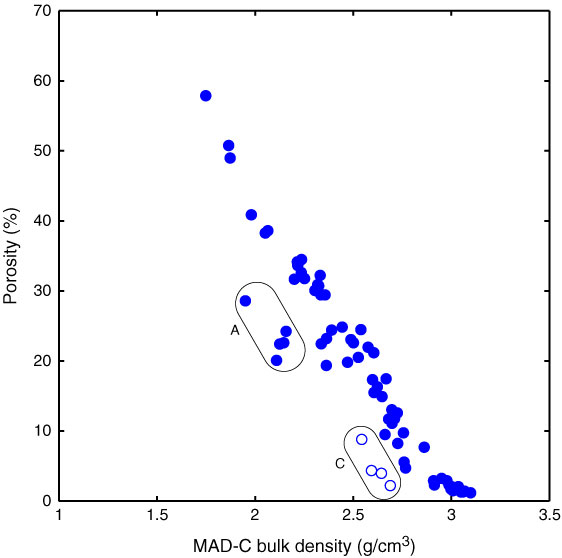
Figure F46. Plot of moisture and density Method C (MAD-C) bulk density vs. porosity of discrete samples, Hole U1376A. Results show an approximately linear negative correlation. Measurements on carbonate samples are shown as open circles and labeled “C,” and samples from the anomalous hyaloclastite interval in Cores 330-U1376A-14R through 16R are labeled “A.”
Previous | Close | Next | Top of page