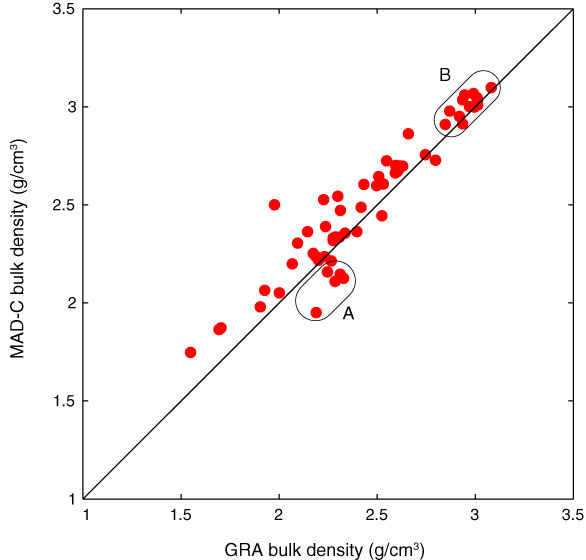
Figure F47. Plot of whole-round gamma ray attenuation (GRA) bulk density vs. moisture and density Method C (MAD-C) bulk density from discrete samples, Hole U1376A. Results show a nearly one-to-one linear relationship, with values from GRA bulk density often slightly lower than those from discrete samples. Data from cluster “B” were measured on samples from massive lava flows of lithologic Units 12, 15, 17, and 29. Samples from the anomalous hyaloclastite interval in Cores 330-U1376A-14R through 16R are labeled “A.”
Previous | Close | Next | Top of page