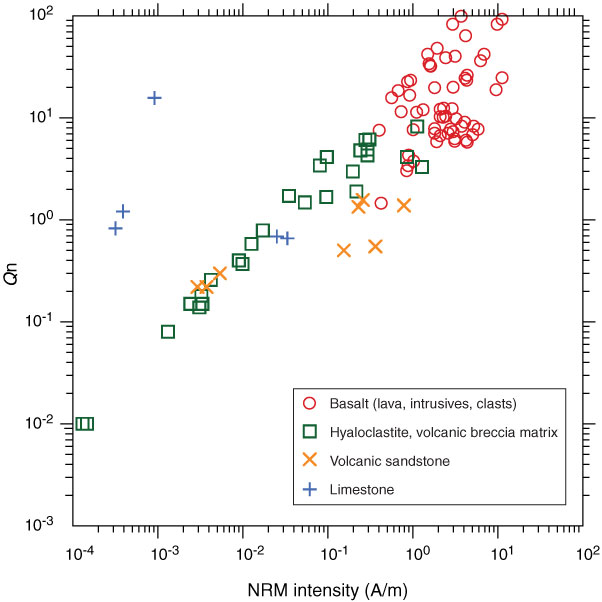
Figure F51. Log-log graph of natural remanent magnetization (NRM) intensity vs. Königsberger ratio (Qn) for discrete samples from different lithologies, Hole U1376A. Two limestone samples have negative susceptibilities (i.e., diamagnetic), and for these we used the absolute values in the calculation of Qn values.
Previous | Close | Next | Top of page