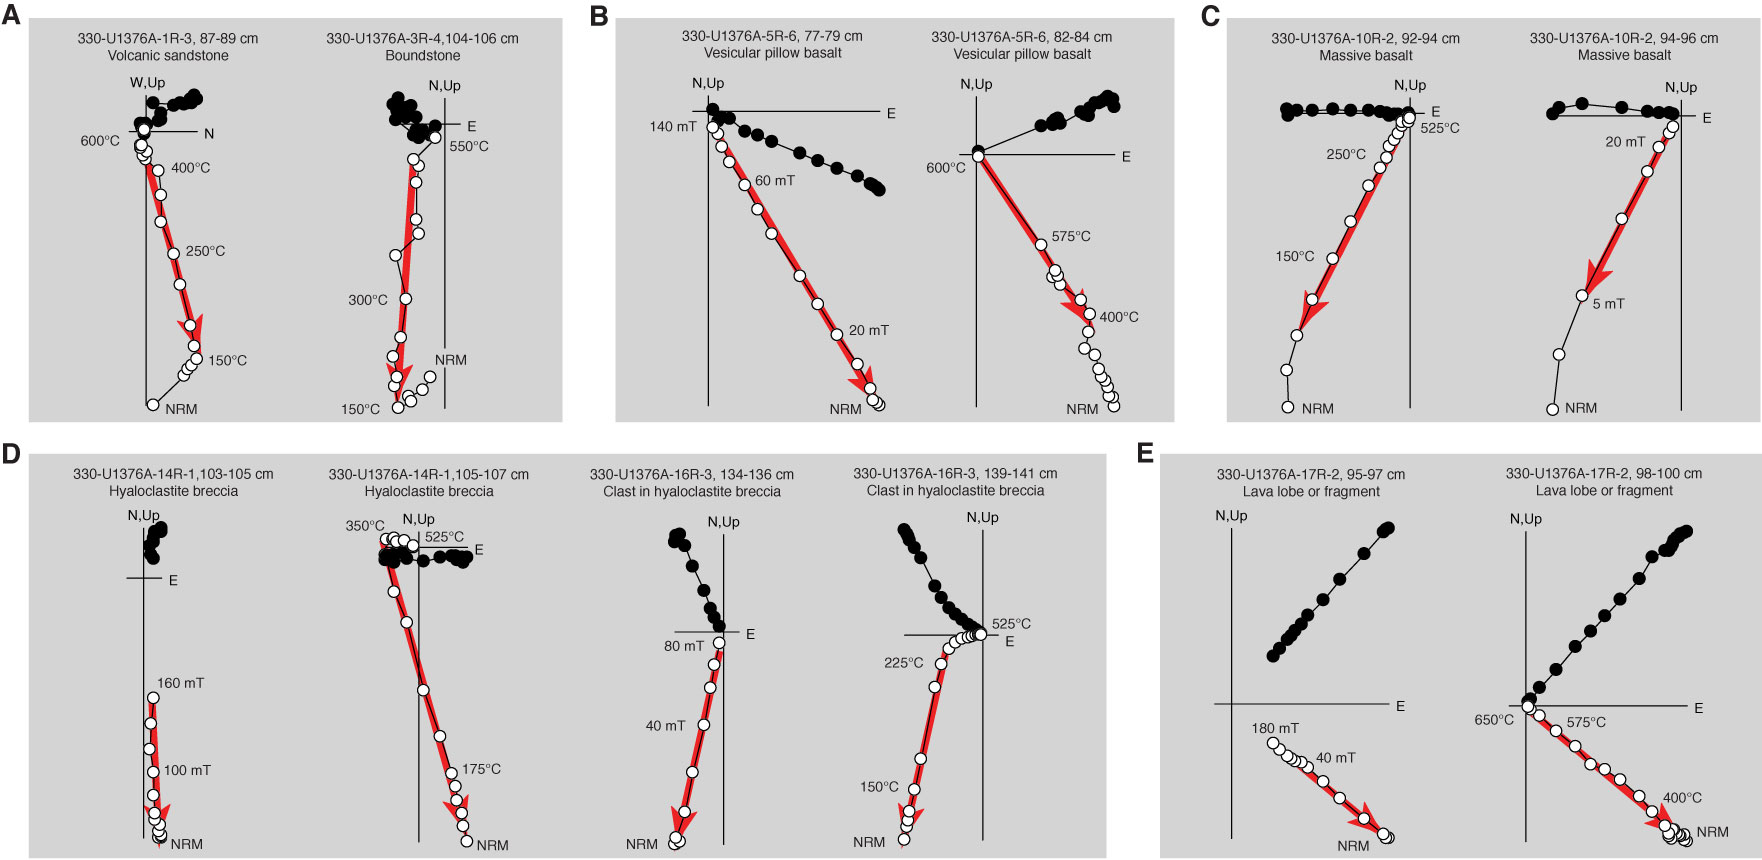
Figure F52. A–E. Representative Zijderveld plots of stepwise AF and thermal demagnetization results from discrete samples, Hole U1376A. Solid circles = projections of vector endpoints onto the horizontal plane, open circles = projections onto the vertical plane. B, C, and E show AF and thermal demagnetization results from adjacent samples. D shows AF and thermal demagnetization results from adjacent samples of hyaloclastite breccia and for a single clast. Red arrows = principal component analysis (PCA) directions with maximum angular deviation ≤ 5°. NRM = natural remanent magnetization.
Previous | Close | Next | Top of page