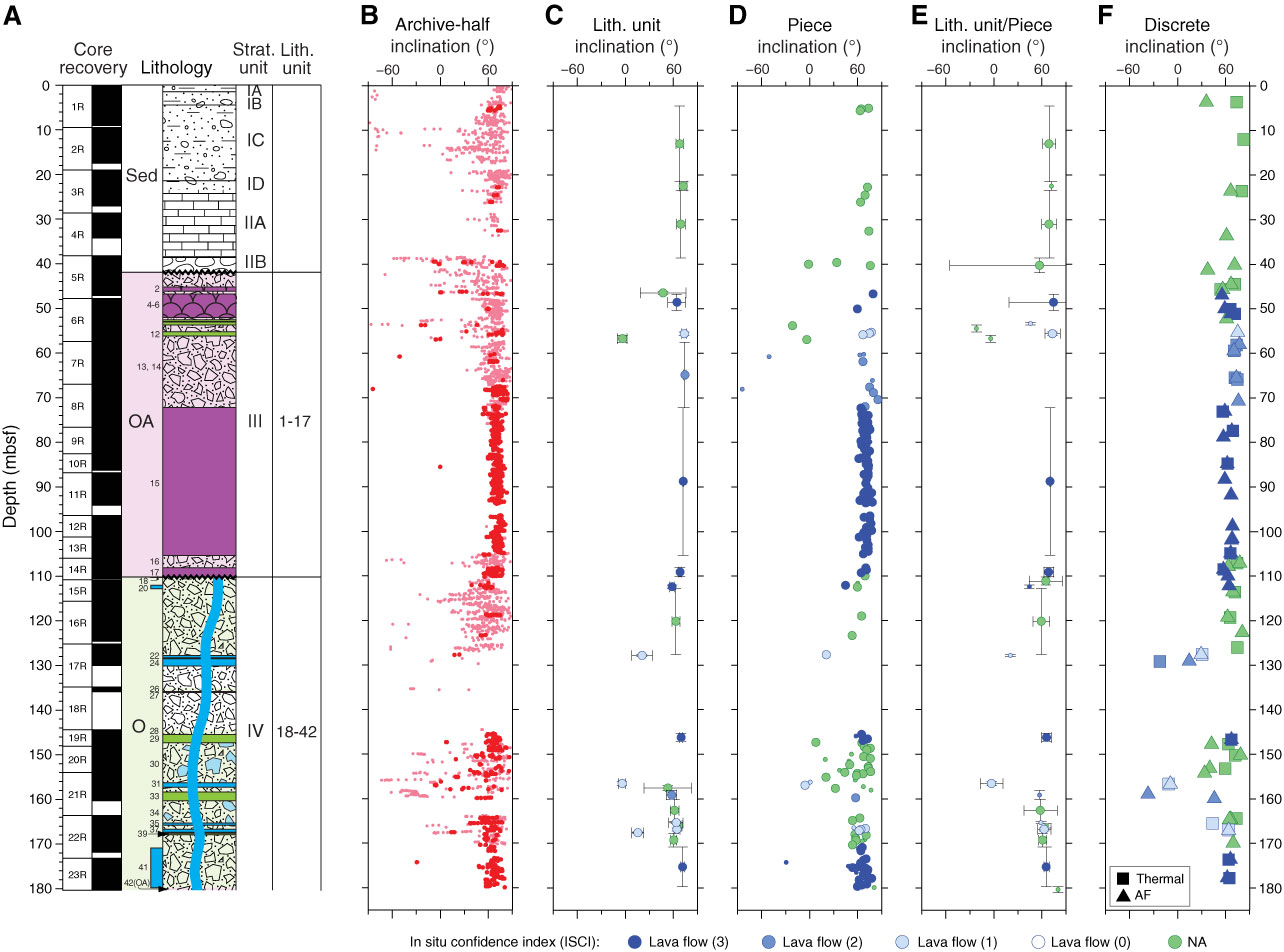
Figure F53. Downhole plots of inclination, Hole U1376A. A. Core recovery and observed stratigraphy (see Fig. F10 for explanation of patterns and abbreviations). B. All downhole inclination data measured at 2 cm intervals on archive-half cores: red = principal component analysis (PCA) directions with misfits ≤ 2.56, pink = PCA directions with misfits > 2.56. C. Average inclination for each lithologic unit (see “Igneous petrology and volcanology”), calculated using inclination-only statistics. D. Average inclination for each core piece longer than 9 cm, calculated using Fisher statistics. E. Average inclination for each lithologic unit, calculated using average piece directions displayed in D and inclination-only statistics. F. Characteristic remanent magnetization inclinations from discrete samples (from alternating-field [AF] or thermal demagnetization) with maximum angular deviation ≤ 5°. Shading scheme for C–F represents the ISCI for identifying distinct lava flow units, where the darkest shade of blue is the most confident and green is not applicable (NA; i.e., deposits cannot have retained their orientation since cooling).
Previous | Close | Next | Top of page