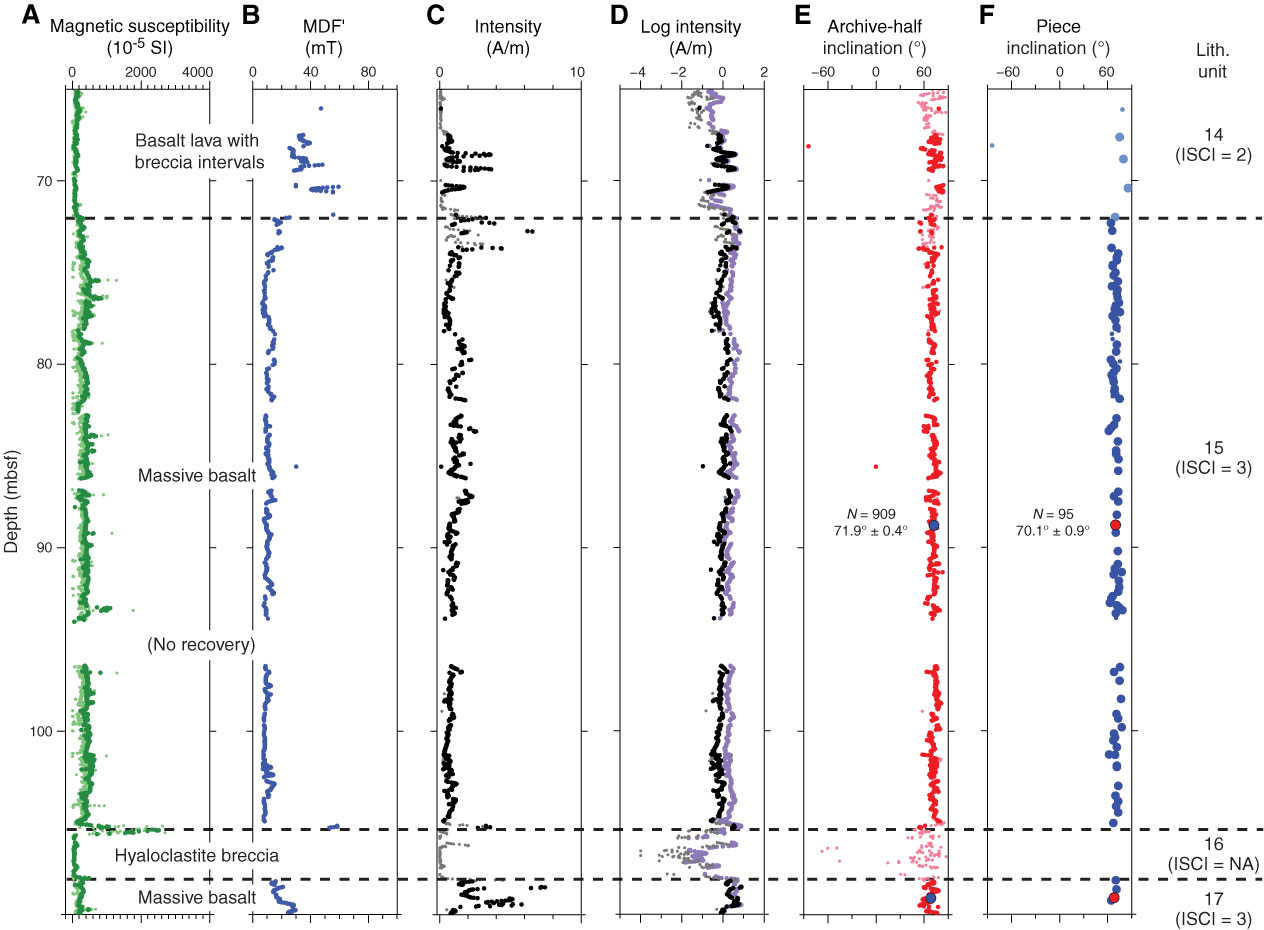
Figure F54. Plots of magnetic parameters recorded over 65–110 mbsf (lithologic Units 14–17), Hole U1376A. A. WRMSL magnetic susceptibility (green) and point magnetic susceptibility (light green) (see “Physical properties”). B. Median destructive field of the vector difference sum (MDF′). C. Remanent magnetization intensity: black = principal component analysis (PCA) directions with misfit ≤ 2.56, gray = PCA directions with misfit > 2.56. D. Log intensity: purple = NRM intensity, black/gray = same as in C. E. Inclination from archive-half core data measured at 2 cm intervals: red = PCA directions with misfit ≤ 2.56, pink = PCA directions with misfit > 2.56, blue = inclination-only average for lithologic Units 15 and 17 (inclination error is the α95 cone of confidence, but is generally smaller than the symbol size). F. Fisher piece-average inclinations from archive-half core data. Dark and light blue symbols represent lithologic units with an in situ confidence index (ISCI) of 3 and 2, respectively. Red = inclination-only average of Fisher piece averages in lithologic Units 15 and 17 (inclination error is the α95 cone of confidence but is generally smaller than the symbol size). NA = not applicable.
Previous | Close | Next | Top of page