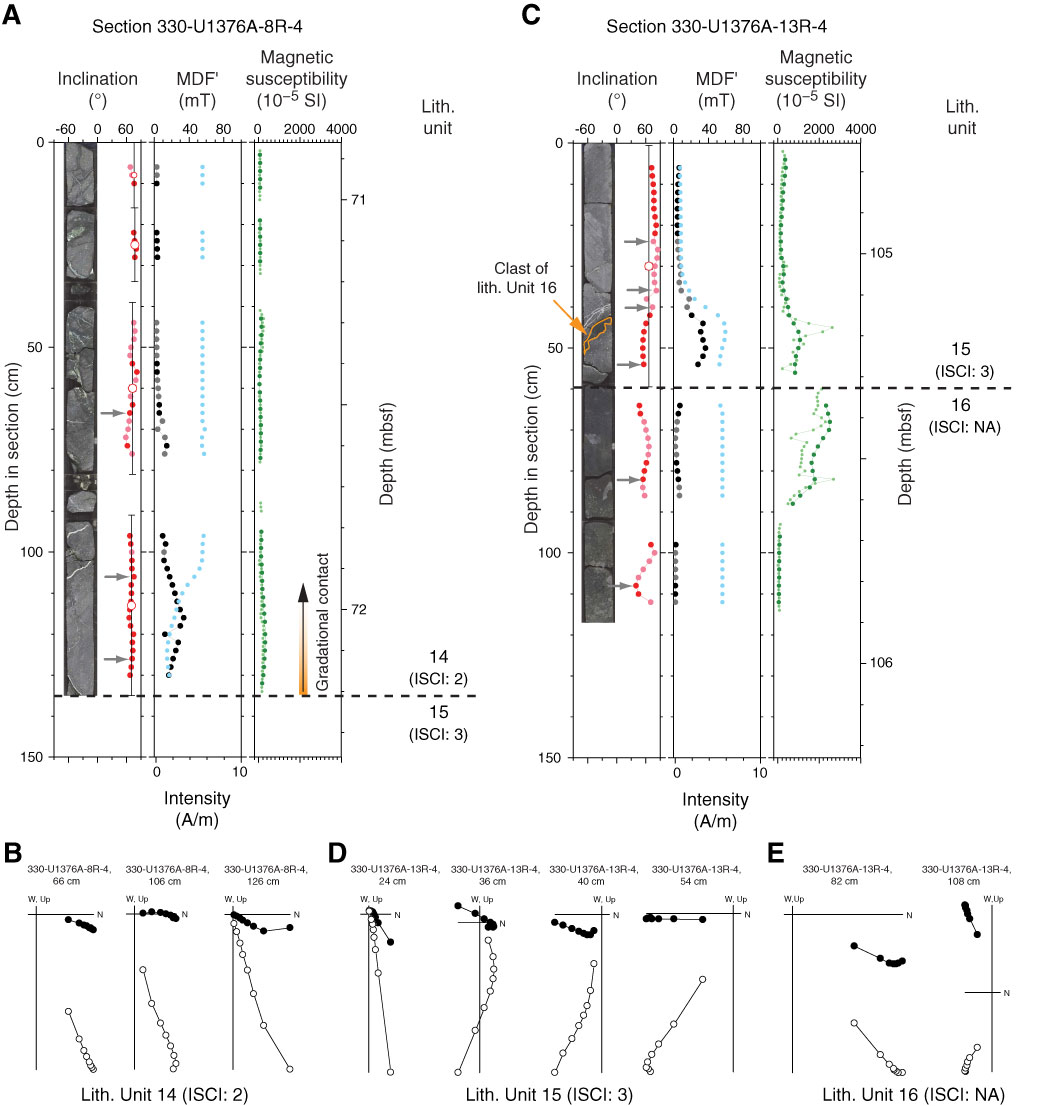
Figure F55. Plots of paleomagnetic data for upper and lower boundaries of lithologic Unit 15, Sections 330-U1376A-8R-4 and 13R-4. A, C. Inclination (solid red symbols = principal component analysis [PCA] inclination with misfit ≤ 2.56, solid pink symbols = PCA inclination with misfits > 2.56, open red symbols = Fisher piece-average inclinations); intensity (solid black symbols = PCA intensity with misfit ≤ 2.56, gray symbols = data with misfits > 2.56); median destructive field of the vector difference sum (MDF′; blue symbols); WRMSL magnetic susceptibility (dark green symbols) and point magnetic susceptibility (light green symbols) (see “Physical properties”). B, D, E. Zijderveld diagrams (sample locations shown by gray arrows in A and C). Solid symbols = projections of vector endpoints onto horizontal plane, open symbols = projections of vector endpoints onto vertical plane. ISCI = in situ confidence index, NA = not applicable.
Previous | Close | Next | Top of page