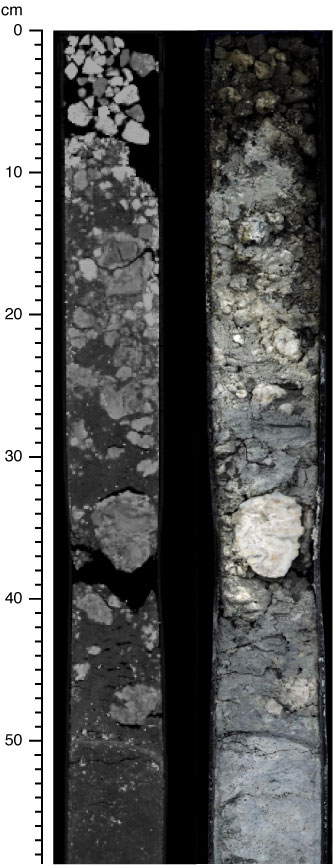
Figure F8. X-ray CT scan (left) and core photograph (right) of nodular anhydrite interval (331-C0013D-2H-1, 0–58 cm). Compare to Figure F6. Note rounding of clast, reduced brightness in X-ray CT image, and aggregate structure.
Previous | Close | Next | Top of page