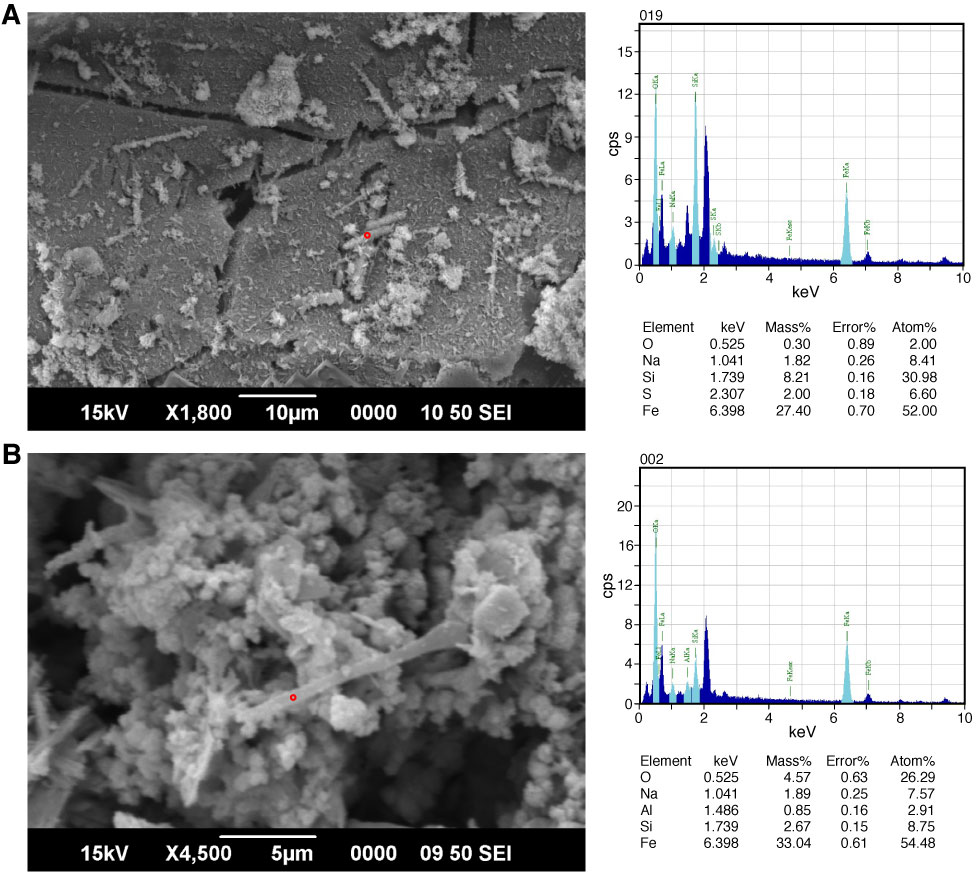
Figure F17. SEM photomicrographs with corresponding energy dispersive spectrometry spectra and quantitative analysis. cps = counts per second. A. Sample 331-C0015C-1H-3, ASW media A. B. Sample 331-C0015C-1H-3, ASW media B. The red circle indicates the location where the energy dispersive spectrometry spectrum was taken.
Previous | Close | Next | Top of page