Previous | Close | Next
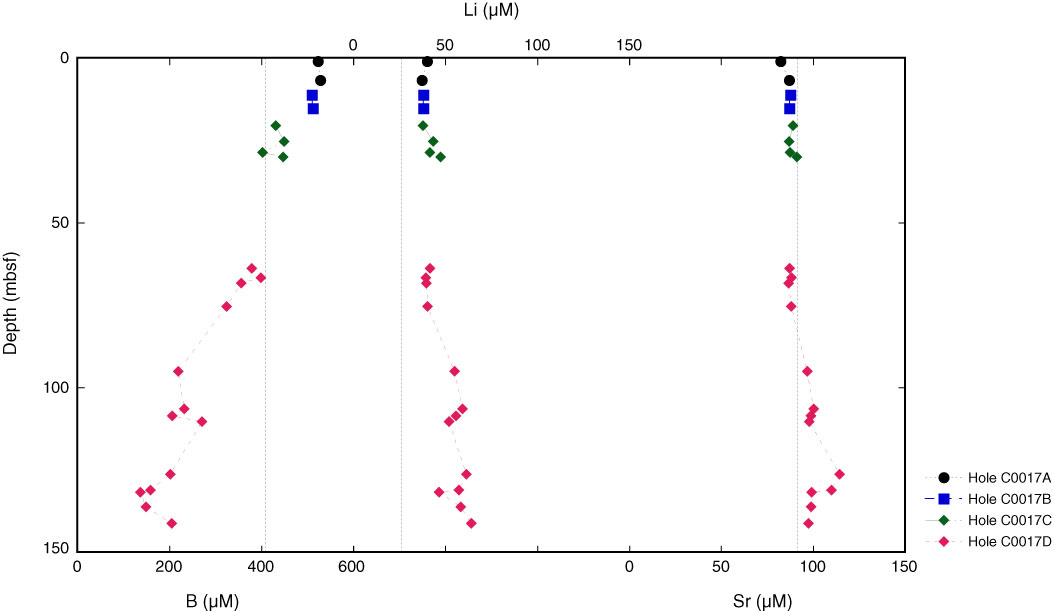
Figure F11. Plot of B, Li, and Sr in pore water from Site C0017. Dashed lines indicate concentrations in seawater as given in Table T6.
Previous | Close | Next | Top of page