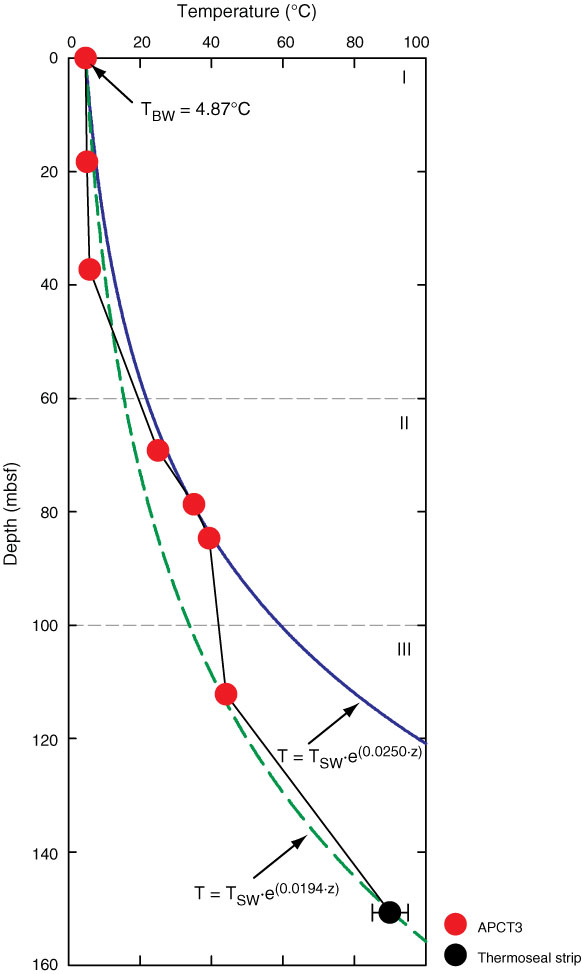
Figure F23. Plot of equilibrium temperature (red circles) and thermal conductivity, Site C0017. The point at 0 mbsf is the average bottom water temperature. Temperatures between 0 and 112 mbsf are from the APCT3 tool, and the temperature at 150.7 mbsf is derived from the thermoseal on the core barrel.
Previous | Close | Next | Top of page