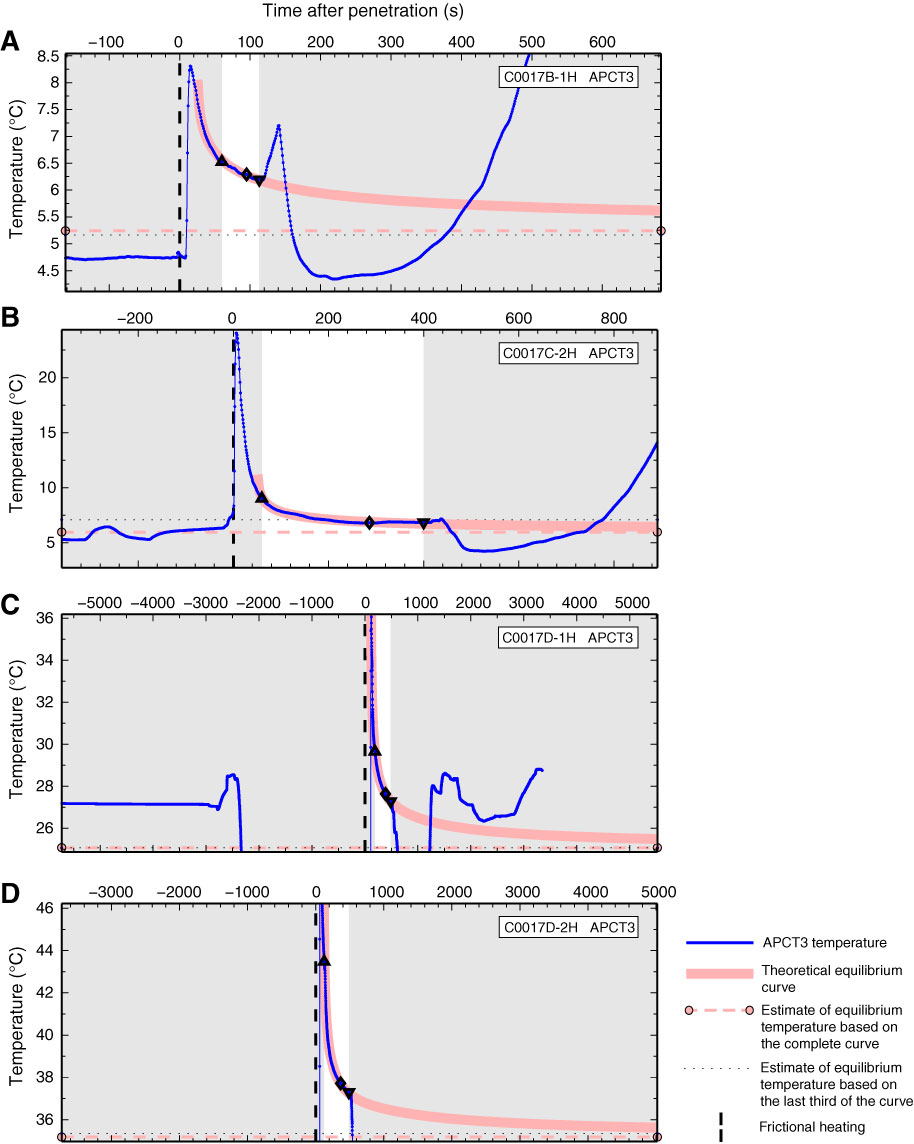
Figure F24. Temperature-time series measured during the deployment of the advanced piston corer temperature (APCT3) tool at Site C0017 (blue line). Unshaded area = data used for equilibrium temperature fit, red line = theoretical equilibrium curve, triangle = beginning of fit, inverted triangle = end of fit, dashed red line with circles = estimate of equilibrium temperature. Note frictional heating at penetration (dashed vertical line). A. Core 331-C0017B-1H, 18.3 mbsf. B. Core 331-C0017C-2H, 37.3 mbsf. C. Core 331-C0017D-1H, 69.2 mbsf. D. Core 331-C0017D-2H, 78.7 mbsf. (Continued on next page.)
Previous | Close | Next | Top of page