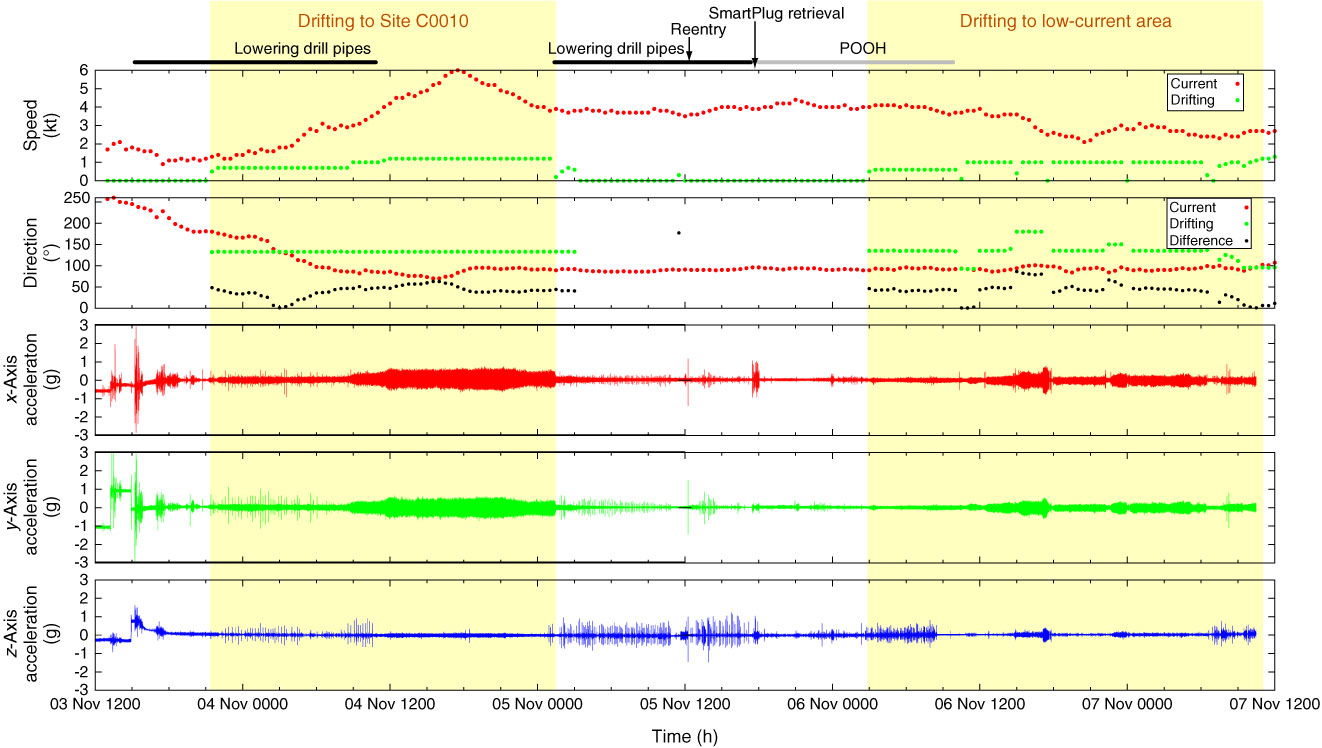
Figure F4. Results of VIV measurements collected from Accelerometer 1 at 461 m DRF during SmartPlug retrieval at Site C0010. The top plot shows the current and drifting speeds. The second plot shows the current and the drifting directions as well as the difference in angle between the current direction and the drifting direction. The bottom three plots show x, y, and z components of the acceleration data versus time. Yellow shaded area = period during drifting to Site C0010 and LCA. POOH = pull out of hole.
Previous | Close | Next | Top of page