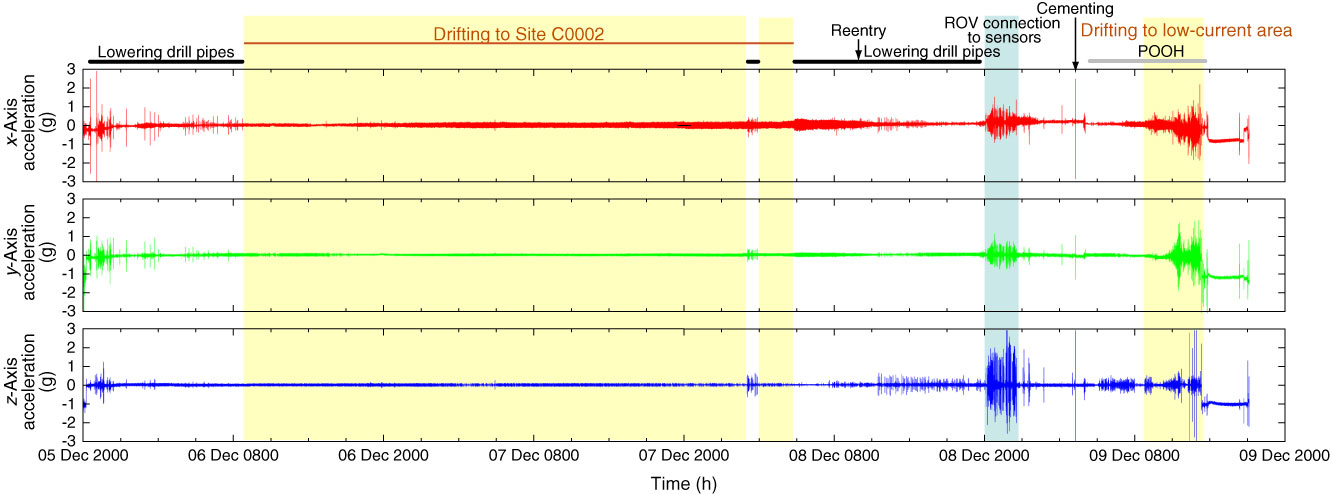
Figure F5. Results of VIV measurement collected from Accelerometer 1 at 1002 m DRF during LTBMS installation at Site C0002. The plots show x, y, and z components of the acceleration data versus time. Yellow shaded area = period during the drifting to Site C0002 and LCA, blue shading = period during which the remotely operated vehicle (ROV) was connected to the sensor package. POOH = pull out of hole.
Previous | Close | Next | Top of page