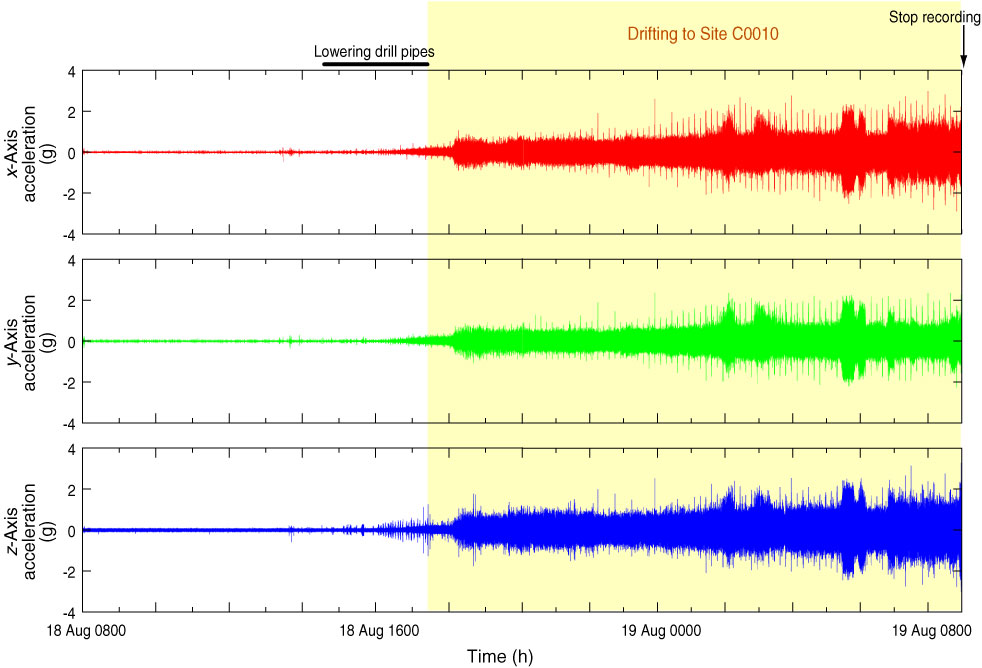
Figure F6. Results of VIV measurements during the dummy run test, Expedition 319 (see Saffer, McNeill, Byrne, Araki, Toczko, Eguchi, Takahashi, and the Expedition 319 Scientists, 2010). The plots show x, y, and z components of the acceleration data versus time. Yellow shaded area = period during drifting to Site C0010.
Previous | Close | Top of page