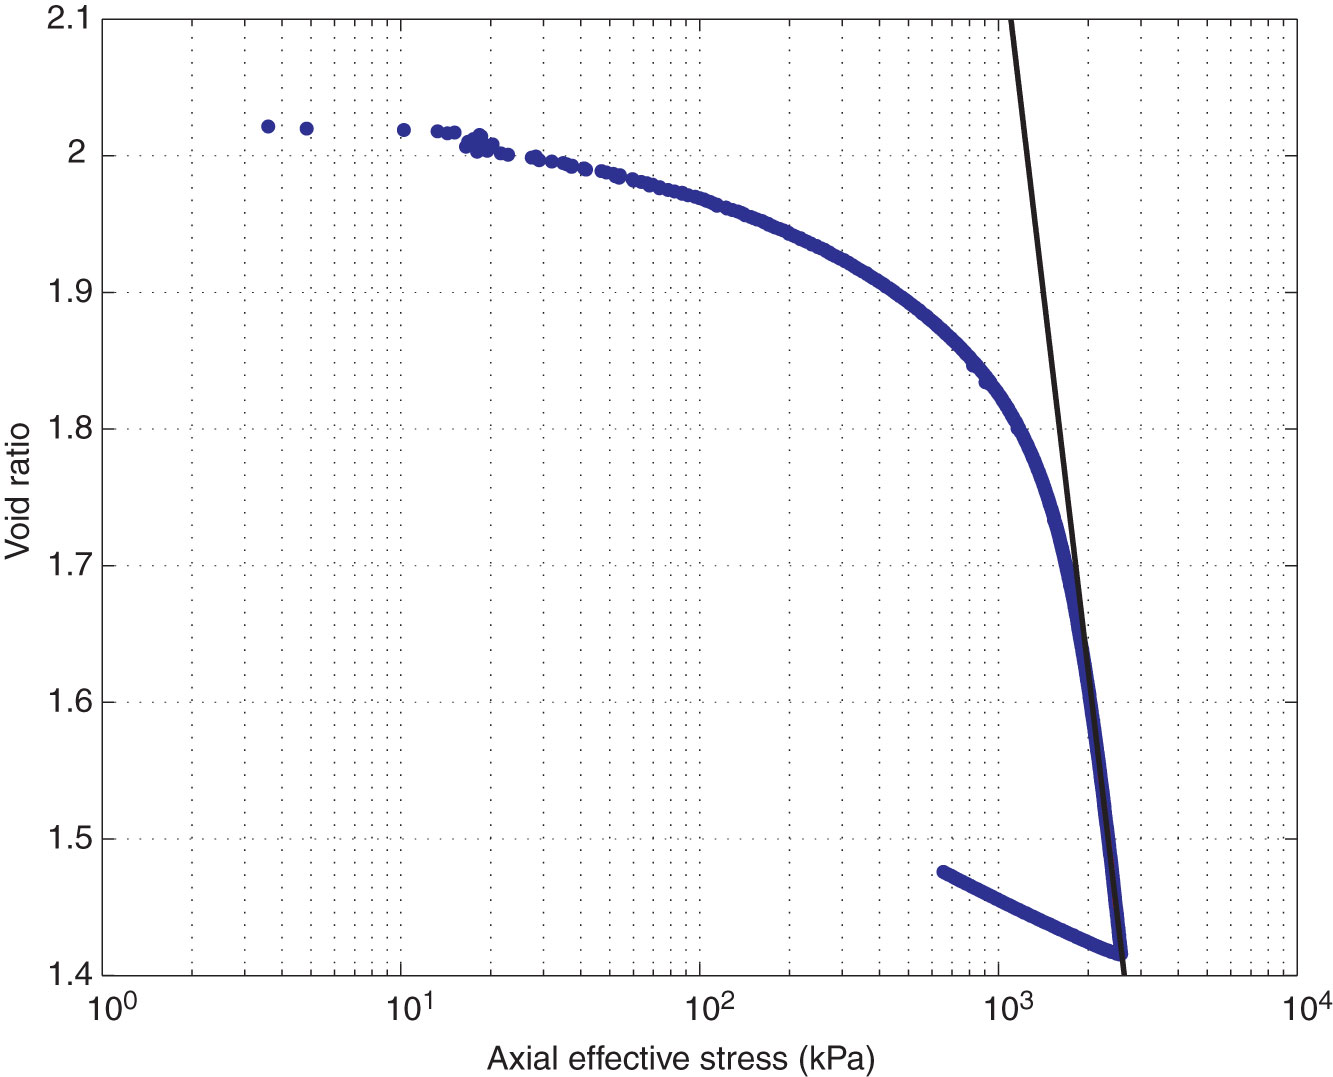
Figure F2. Constant-rate-of-strain (CRS) consolidation experiment data from Experiment CRS100 (Table T2). Blue circles = experiment data. Black line is the fit to the virgin consolidation portion of the data and used to determine Cc. Complete data for all CRS consolidation experiments are available in 333_CONSOL in “Supplementary material.”
Previous | Close | Next | Top of page