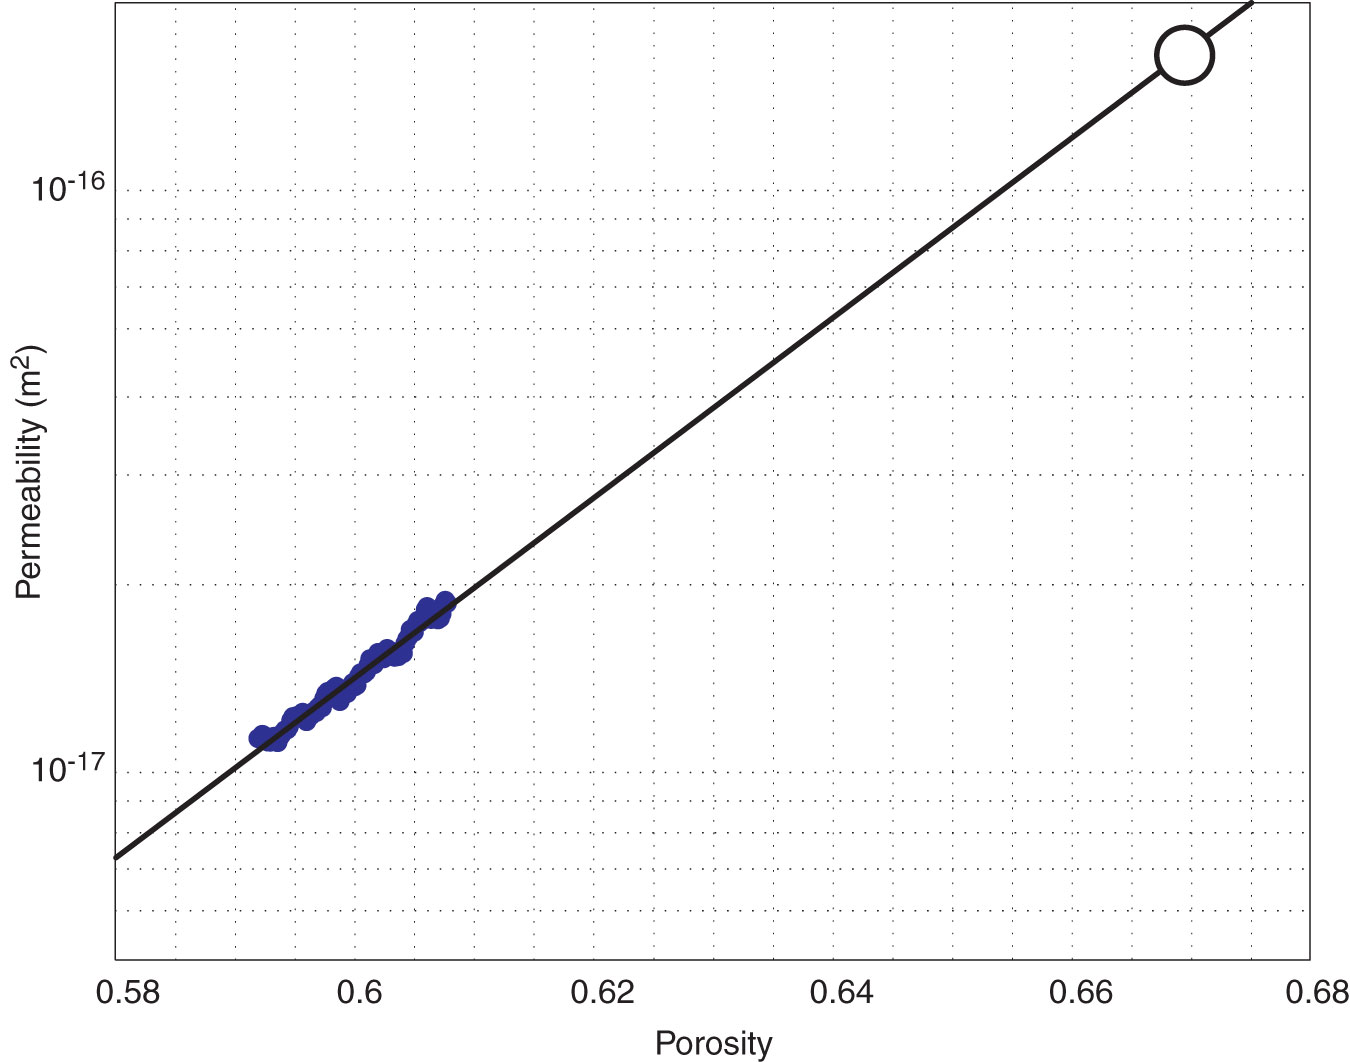
Figure F3. Permeability-porosity data from the virgin consolidation portion of Experiment CRS100 (Table T2). Blue circles = experiment data. Black line is the fit to the data used to determine k0 at the initial porosity (white circle).

Previous | Close | Next | Top of page