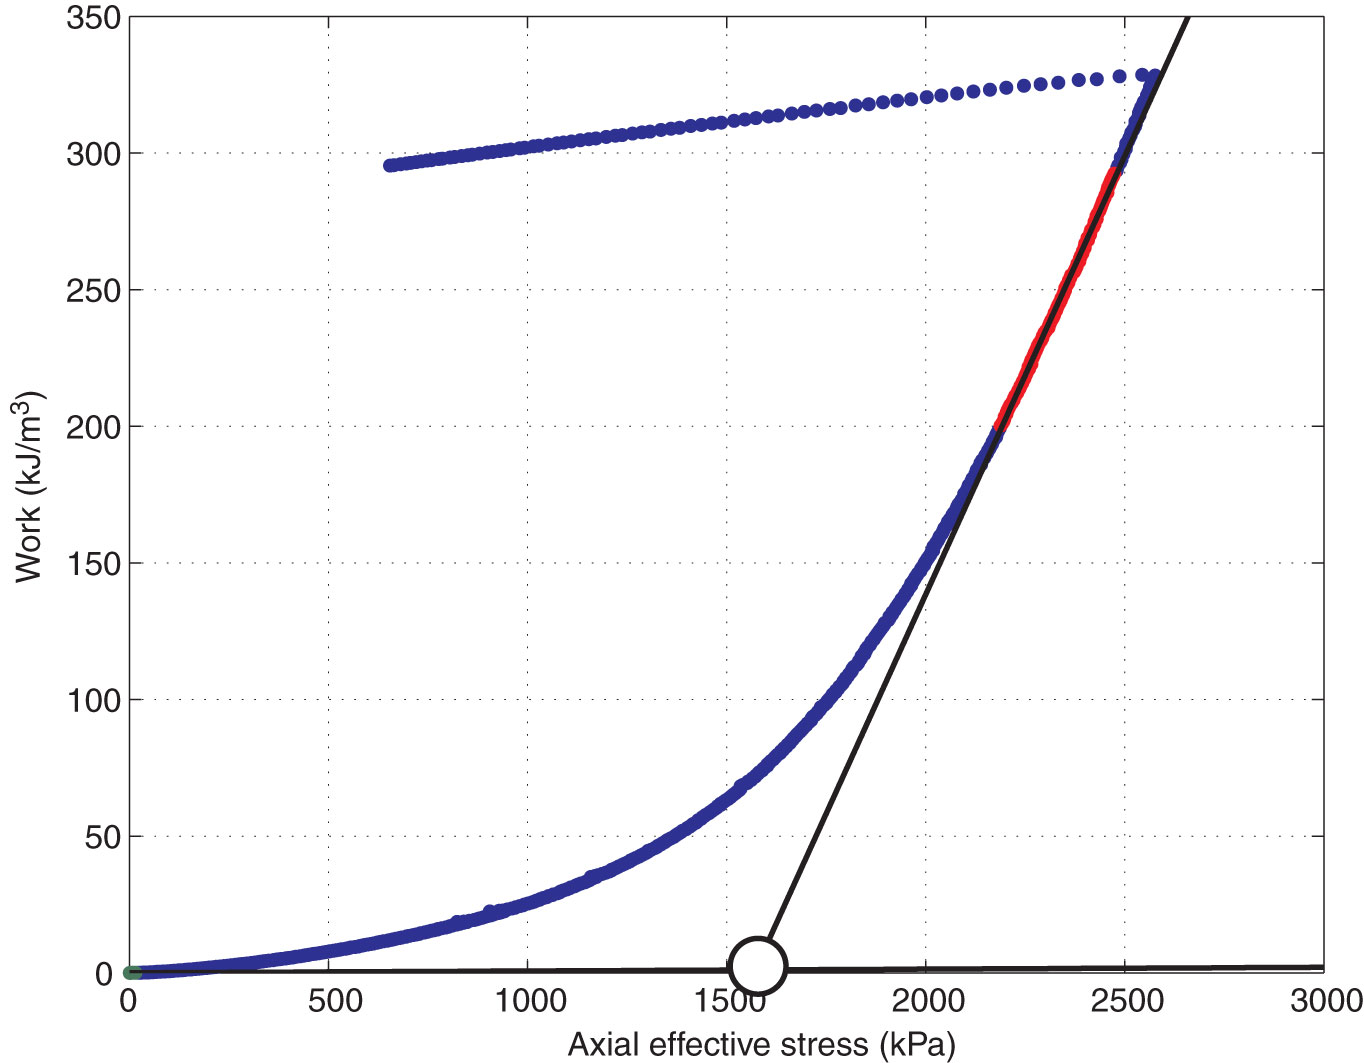
Figure F4. Work-stress data from Experiment CRS100 (Table T2). Blue circles = experiment data. Blue and red circles correspond respectively to the preyield and virgin consolidation (postyield) portions of the data used to constrain σpc’. Black lines are the fit to these portions of the data. Intersection of lines corresponds to σpc’ (white circle).
Previous | Close | Next | Top of page