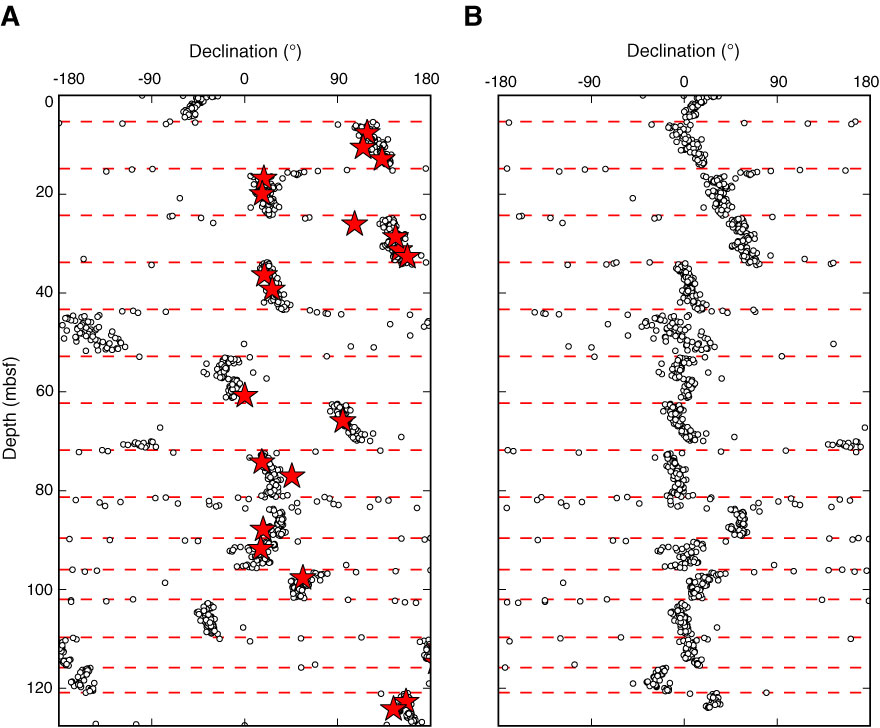
Figure F33. Plots of declination variations of paleomagnetic measurements on archive sections after 15 mT AF demagnetization for APC cores in Hole U1378B plotted in (A) IODP coordinates and (B) geomagnetic frame based on Flexit tool orientation. Red stars represent characteristic remanent magnetization of discrete samples, and dashed red horizontal lines represent core boundaries.
Previous | Close | Next | Top of page