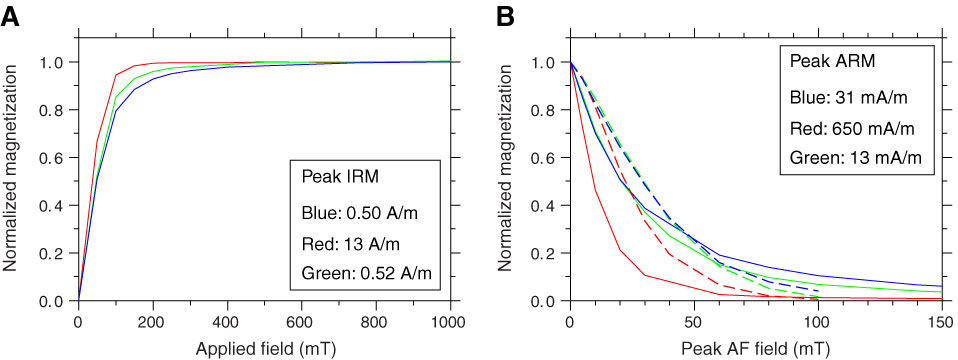
Figure F34. Plots of rock magnetic results from Samples 334-U1378B-15H-3, 63–65 cm (~90–190 mbsf; red); 5H-2, 104–106 cm (above the interval; blue); and 32X-2, 94–96 cm (below the interval; green). A. Isothermal remanent magnetization (IRM) acquisition curves showing saturation before 500 mT for all three samples. B. Alternating-field (AF) demagnetization curves of IRM (solid lines) and anhysteretic remanent magnetization (ARM; dashed lines) showing moderate magnetic stability.

Previous | Close | Next | Top of page