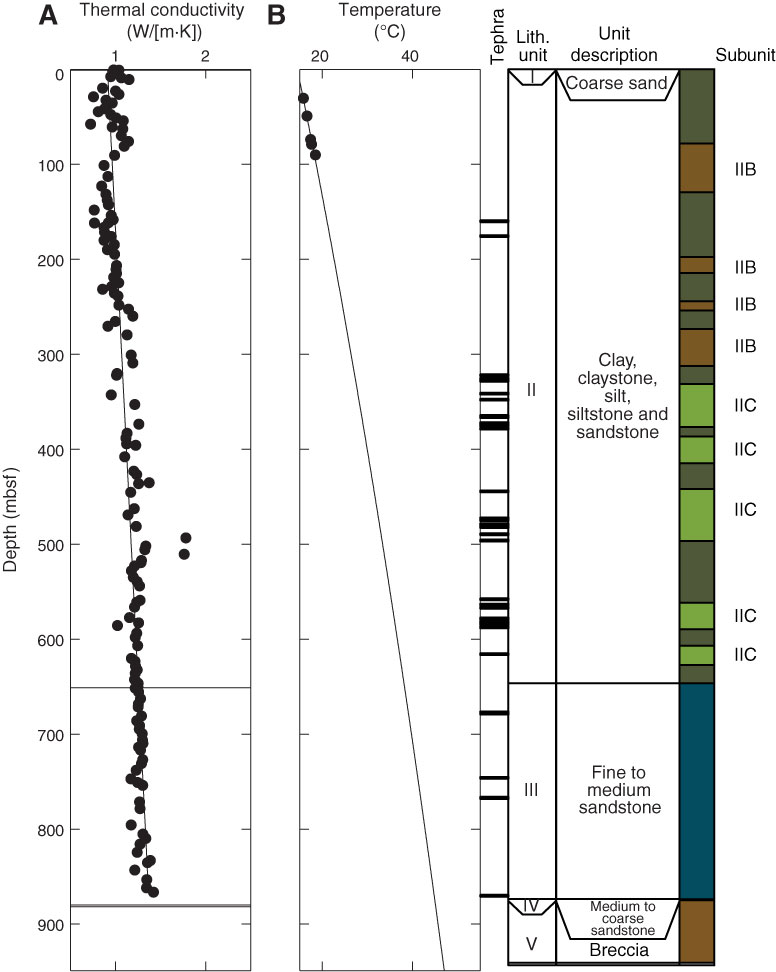
Figure F33. Plots of thermal data, Site U1379. A. Thermal conductivity values as a function of depth. B. Equilibrium temperatures. Estimated temperature (line) based on linear fit to thermal conductivity and thermal gradient.
Previous | Close | Next | Top of page