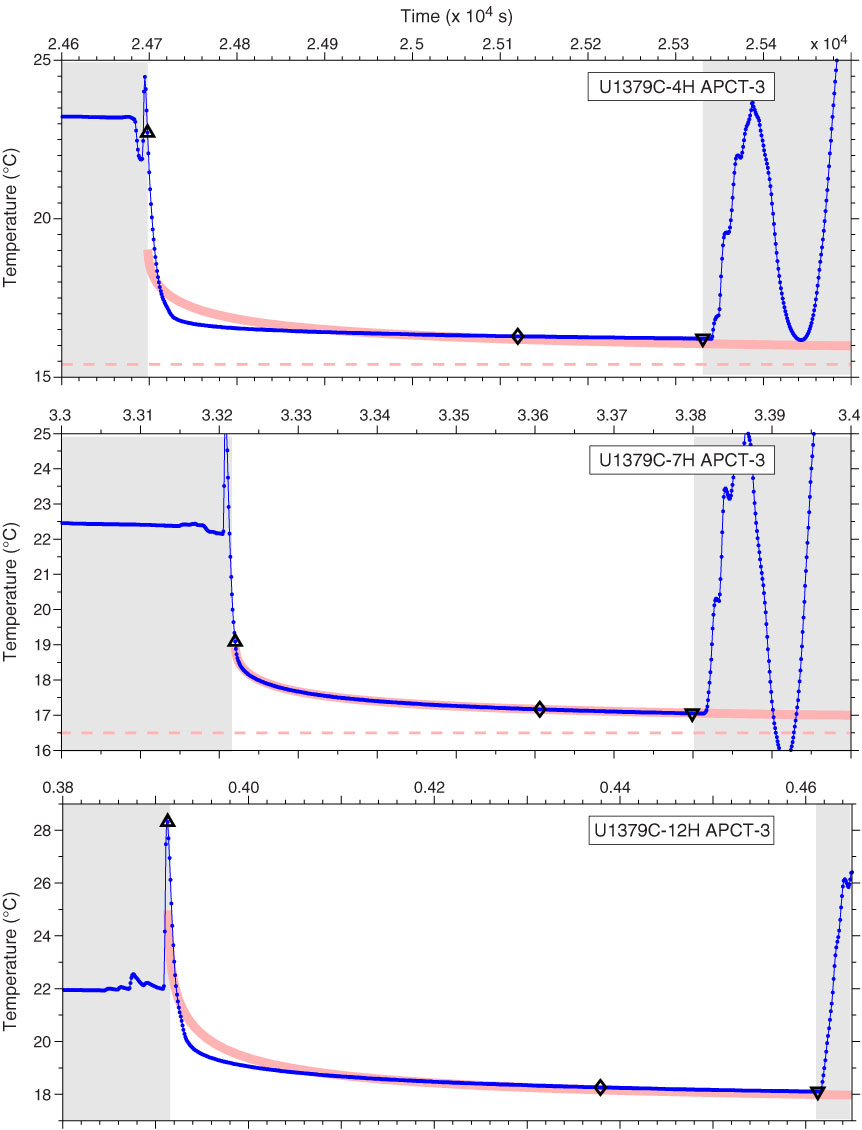
Figure F34. Plots of temperature-time series measured during the deployment of the advanced piston corer temperature tool (APCT-3), Site U1379. Unshaded area indicates data used for equilibrium temperature fit. Triangle indicates beginning of fit and inverted triangle indicates end of fit. (Continued on next page.)
Previous | Close | Next | Top of page