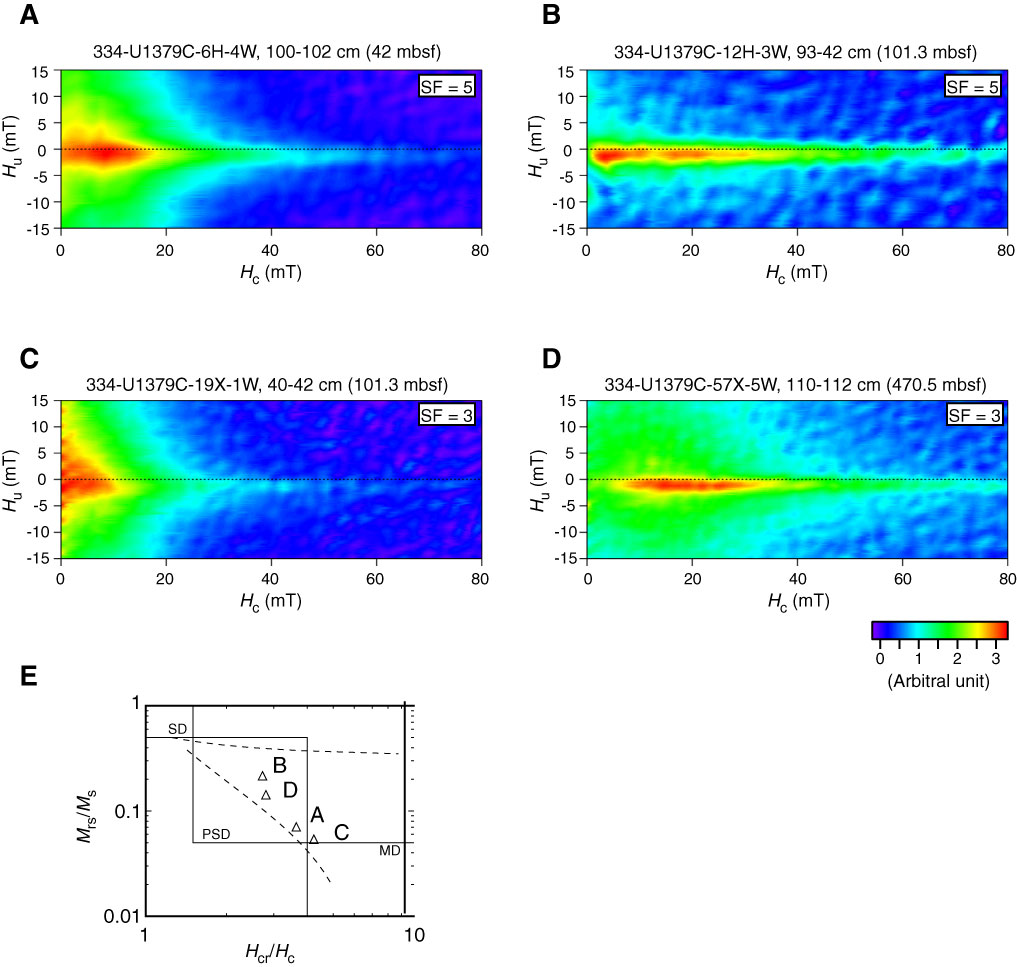
Figure F4. A–D. FORC diagrams for Hole U1379C samples shown in arbitral unit. Smoothing factors (SF) were used to calculate the diagrams. E. Day plot of samples used in the FORC analysis. Letters = corresponding FORC diagram.
Previous | Close | Next | Top of page