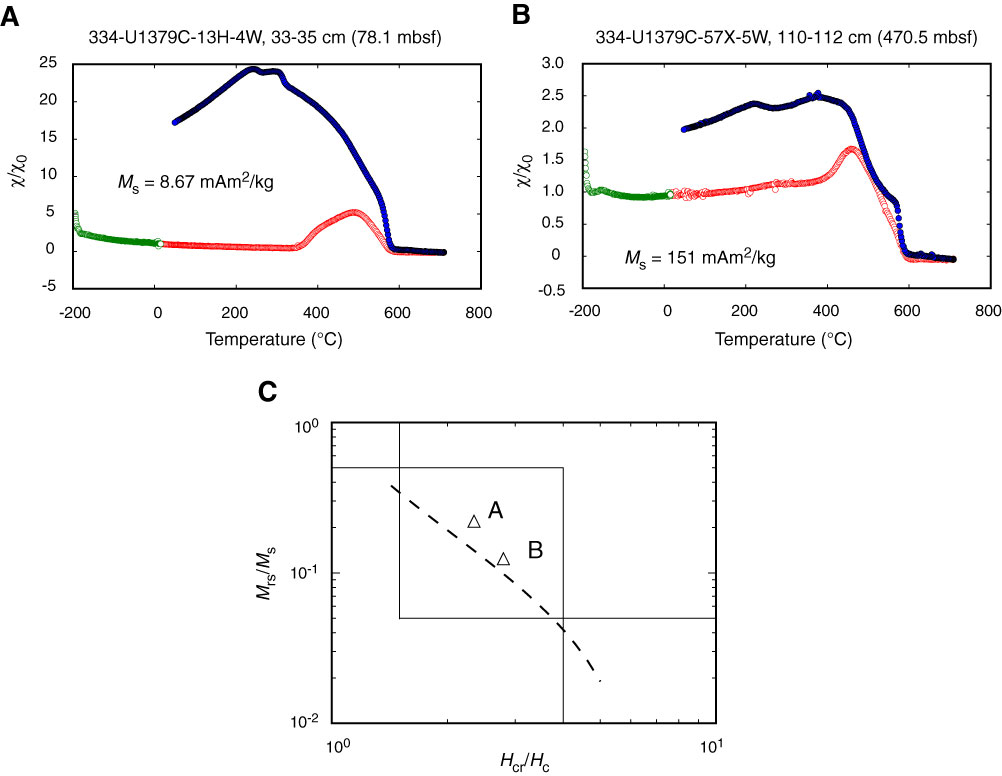
Figure F5. Thermomagnetic analysis, Hole U1379C. A, B. Temperature dependence of magnetic susceptibility, χ. Data are normalized by room temperature susceptibility before treatment (χ0). Green circles = heating from –92°C, red circles = heating to 700°C, blue circles = cooling from 700°C. C. Day plot of samples used in thermomagnetic analysis. Letters = corresponding thermomagnetic curves.
Previous | Close | Top of page