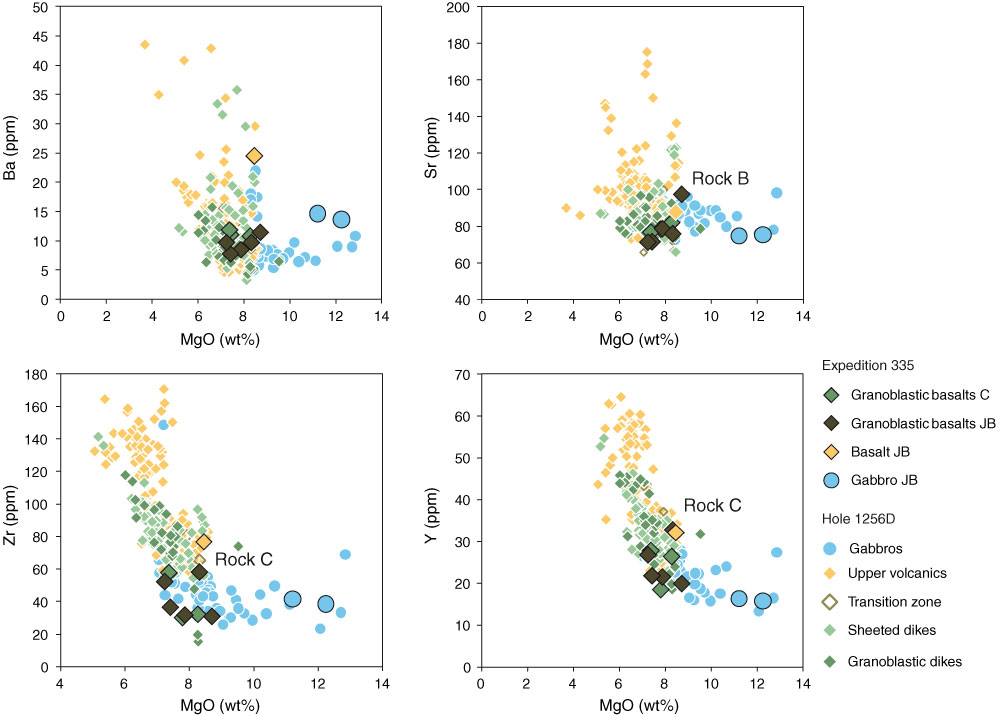
Figure F33. Plot of variability of Ba, Sr, Zr, and Y contents as a function of MgO in samples collected during Expedition 335 compared with existing previous data from Hole 1256D (Neo et al., 2009; Yamazaki et al., 2009; Teagle et al., unpubl. data). Granoblastic dikes = granoblastic dikes from above Gabbro 1 and granoblastic basalts from Dike Screens 1 and 2 sampled during previous expeditions. C = cored samples, JB = samples retrieved during junk basket runs.
Previous | Close | Next | Top of page