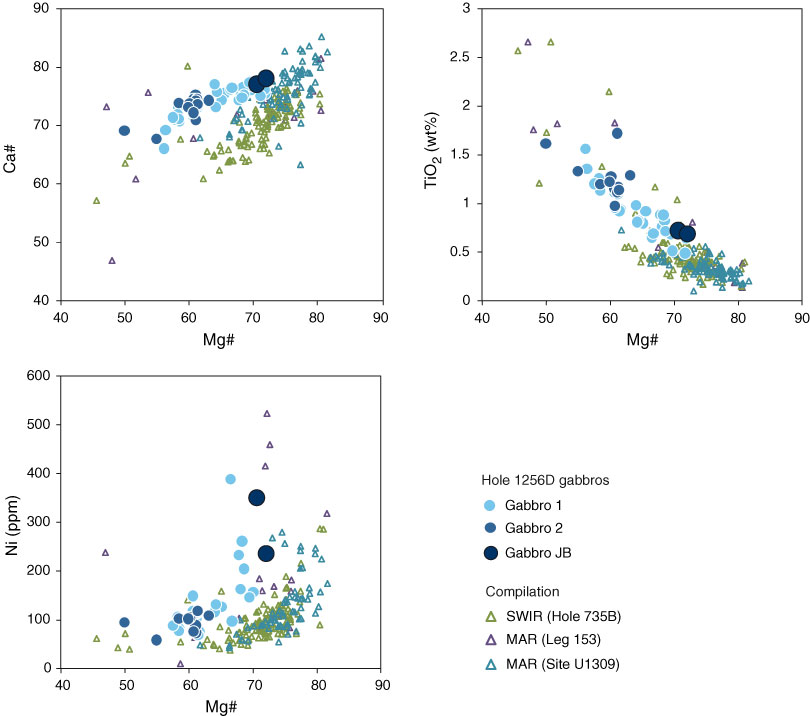
Figure F34. Plot of variability of Ca#, TiO2, and Ni as a function of Mg# for gabbros analyzed during Expedition 335 (Gabbro 1 and Gabbro 2) compared with existing data from Hole 1256D (Gabbro JB) (Neo et al., 2009; Yamazaki et al., 2009; Teagle et al., unpubl. data). Also shown for comparison are published data for gabbros sampled on the Mid-Atlantic Ridge (MAR) during Leg 153 (Mid-Atlantic Ridge Kane Fracture Zone area; Agar et al., 1997), at Atlantis Massif (MAR 30°N; Godard et al., 2009), and on the Southwest Indian Ridge (SWIR) in Hole 735B (Dick, Natland, Miller, et al., 1999). JB = samples retrieved during junk basket runs.
Previous | Close | Next | Top of page