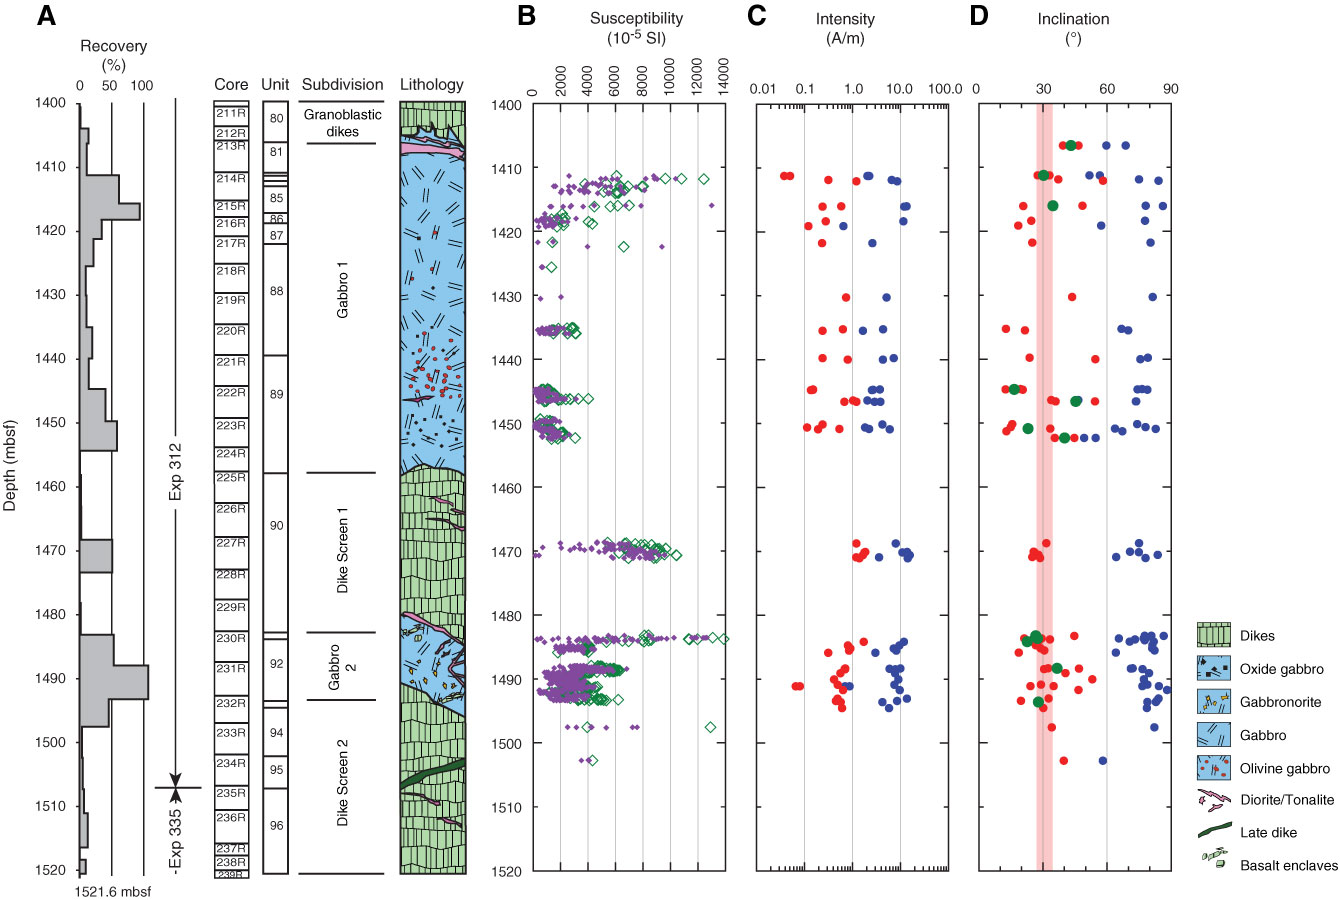
Figure F82. Plot of downhole variations in magnetic properties in Hole 1256D from the top of Gabbro 1. A. Summary of core recovery and lithostratigraphic units. B. Low-field magnetic susceptibility. Purple symbols = Section Half Multisensor Logger point susceptibility data, green symbols = Whole-Round Multisensor Logger loop susceptibility data. C. Natural remanent magnetization (NRM; blue symbols) and characteristic remanent magnetization (ChRM; red symbols) intensities from discrete samples. D. NRM (blue symbols) and ChRM (red symbols) inclinations from discrete samples. Green symbols = average ChRM inclinations for core pieces where multiple discrete samples are available. Pink vertical bar = mean ChRM inclination calculated using the maximum likelihood method of Arason and Levi (2010).
Previous | Close | Next | Top of page