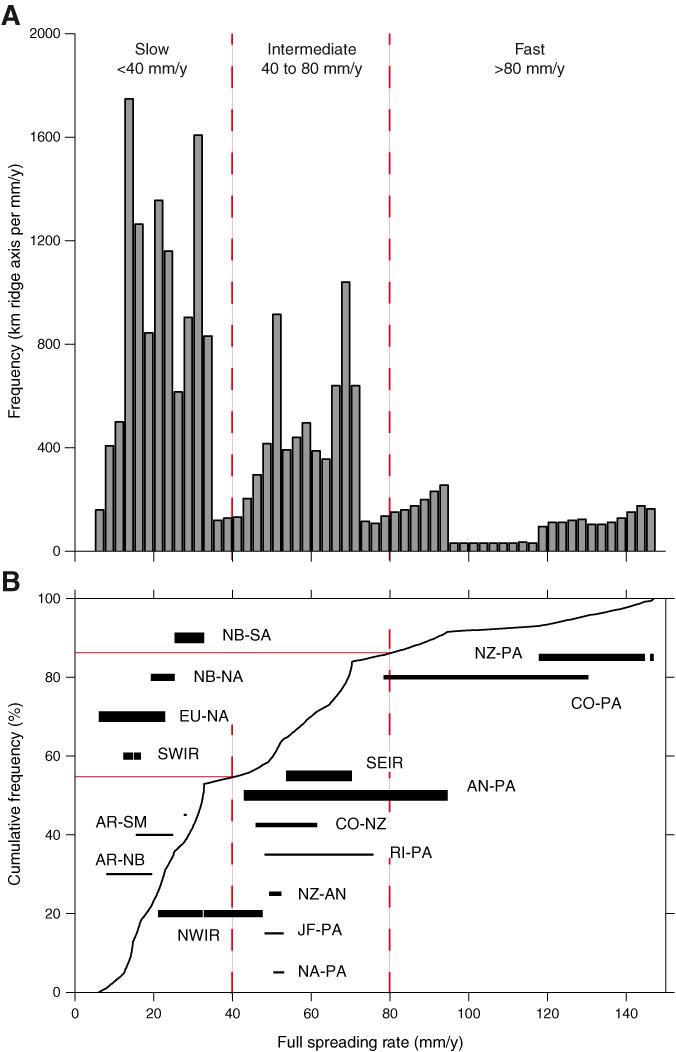
Figure F1. Distribution of spreading rates for major active plate boundaries, presented (A) in histogram form and (B) as cumulative distribution. Rates are the best-fit rates of the MORVEL model (DeMets et al., 2010), and ridge length is measured as the component perpendicular to spreading direction. Horizontal lines on the cumulative plot show the range of spreading rate for each plate pair, with line width scaled approximately to plate boundary length. Plate-pair labels follow the MORVEL (mid-ocean ridge velocities) convention, except in the Indian Ocean where the southeast, southwest, and northwest branches of the ridge system are grouped for 2–3 plate pairs to simplify labeling. NB = Nubia plate, SA = South America plate, NZ = Nazca plate, PA = Pacific plate, NA = North America plate, CO = Cocos plate, EU = Eurasian plate, SWIR = Southwest Indian Ridge, SEIR = Southeast Indian Ridge, AN = Antarctic plate, AR = Arabia plate, SM = Somalia plate, RI = Rivera plate, NWIR = Northwest Indian Ridge, JF = Juan de Fuca plate.
Close | Next | Top of page