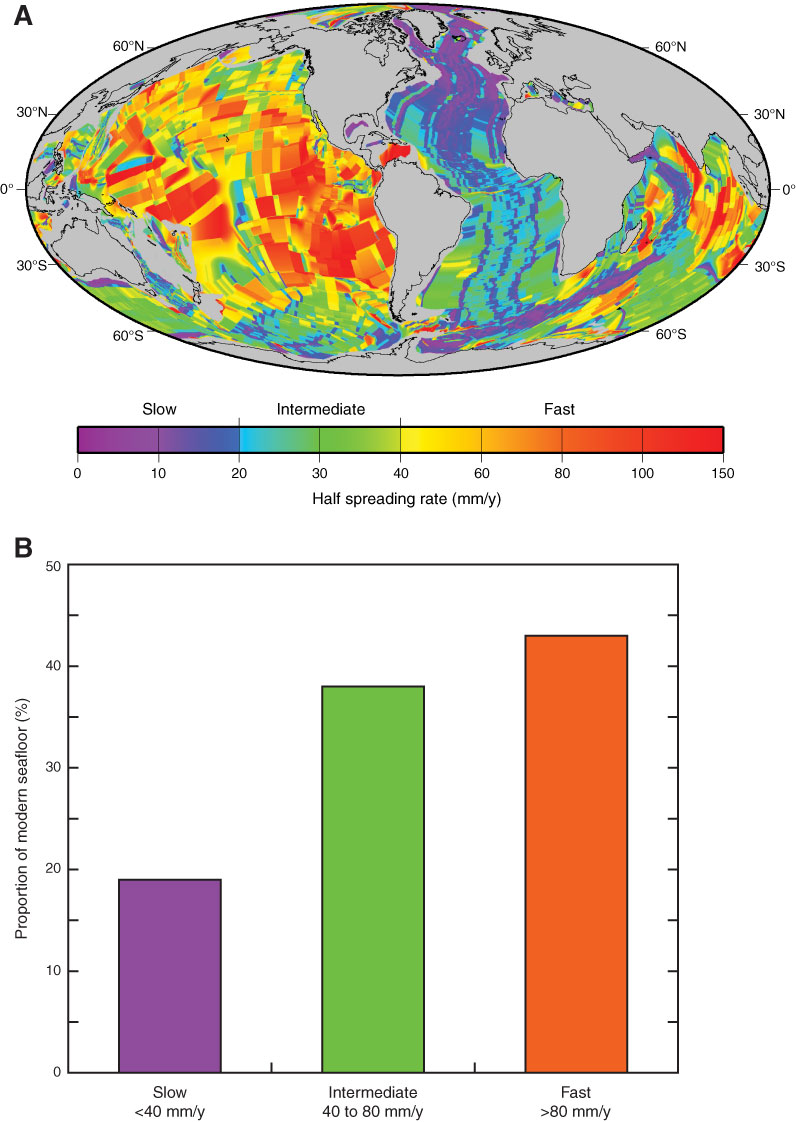
Figure F2. A. Global view of ocean crust colored by spreading rate at time of formation, based on age and spreading rate grids by Müller et al. (2008), revised version 3 (www.earthbyte.org/). B. Histogram comparing the proportions of the present-day ocean crust that formed at slow, intermediate, and fast spreading rates, based on the rate grid plotted in A. Tabulation includes variation of grid-cell area with latitude. Labeled spreading rates are twice the half rate for comparison with full rates.
Previous | Close | Next | Top of page