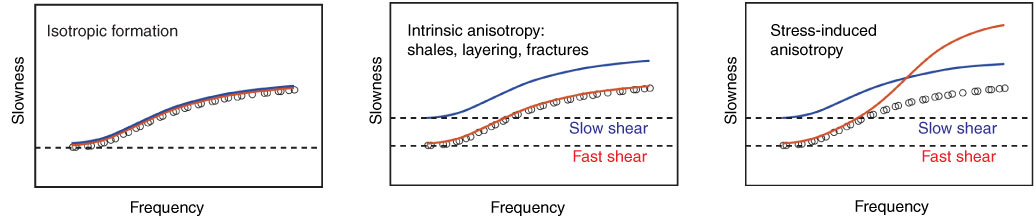
Figure F4. Schematic cross-dipole dispersion curves illustrating isotropic and anisotropic formations. In homogeneous isotropic medium (left panel), observed dispersion curves for the orthogonal fast and slow shear wave components (red and blue curves) are identical and match modeled flexural wave dispersion (black circles). In homogeneous anisotropic medium (middle panel), such as one with intrinsic anisotropy created by cracks or other features, the fast and slow dispersion curves are offset, but parallel. In inhomogeneous anisotropic medium (right panel), such as created by stress-induced anisotropy, the two observed dispersion curves crossover at an intermediate frequency (Arroyo Franco et al., 2006).
Previous | Close | Next | Top of page