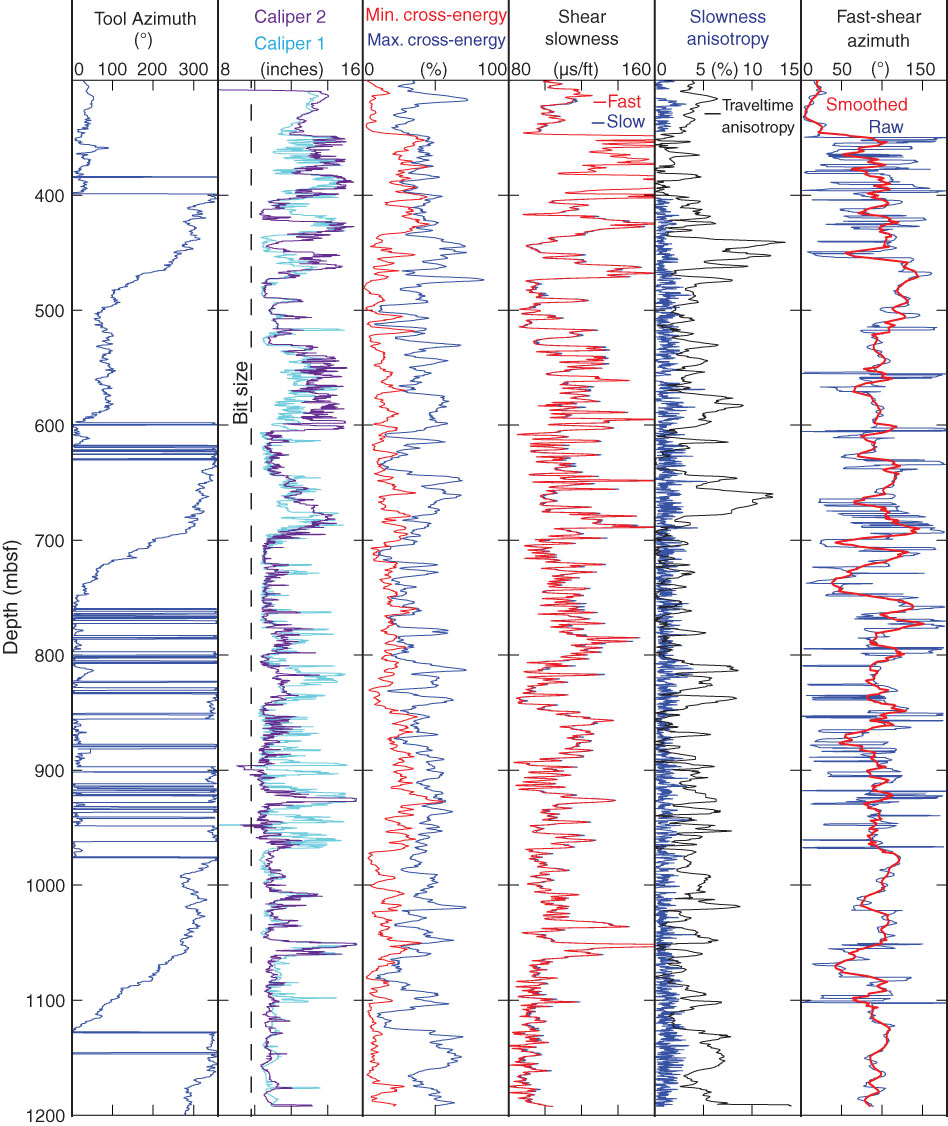
Figure F5. Sonic anisotropy analysis results, Hole 1256D. Tool azimuth is as indicated by the orientation of Pad 1, minimum and maximum cross-energy is after Alford rotation, and fast-shear and slow-shear slowness is determined from the rotated wave fields. For fast-shear azimuth, smoothed data is the 10 m running average.
Previous | Close | Next | Top of page