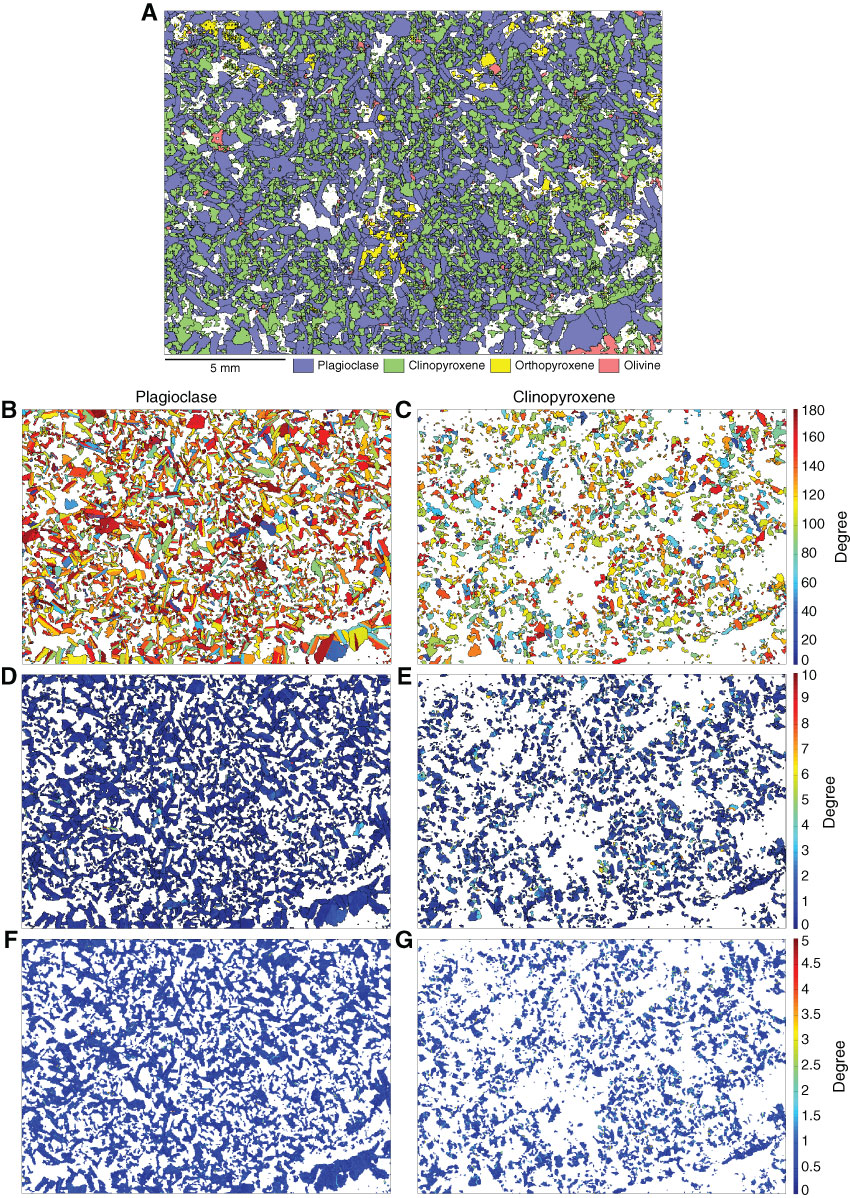
Figure F4. Electron backscatter diffraction maps for Sample 312-U1256D-232R-2, 38–40 cm. See text for further explanation. A. Indexed phases. B, C. Orientation. Color scale indicates the minimum angle between the measured pixel and the reference (0,0,0) Euler orientation. D, E. Misorientation to grain mean. F, G. Kernel average misorientation.
Previous | Close | Next | Top of page