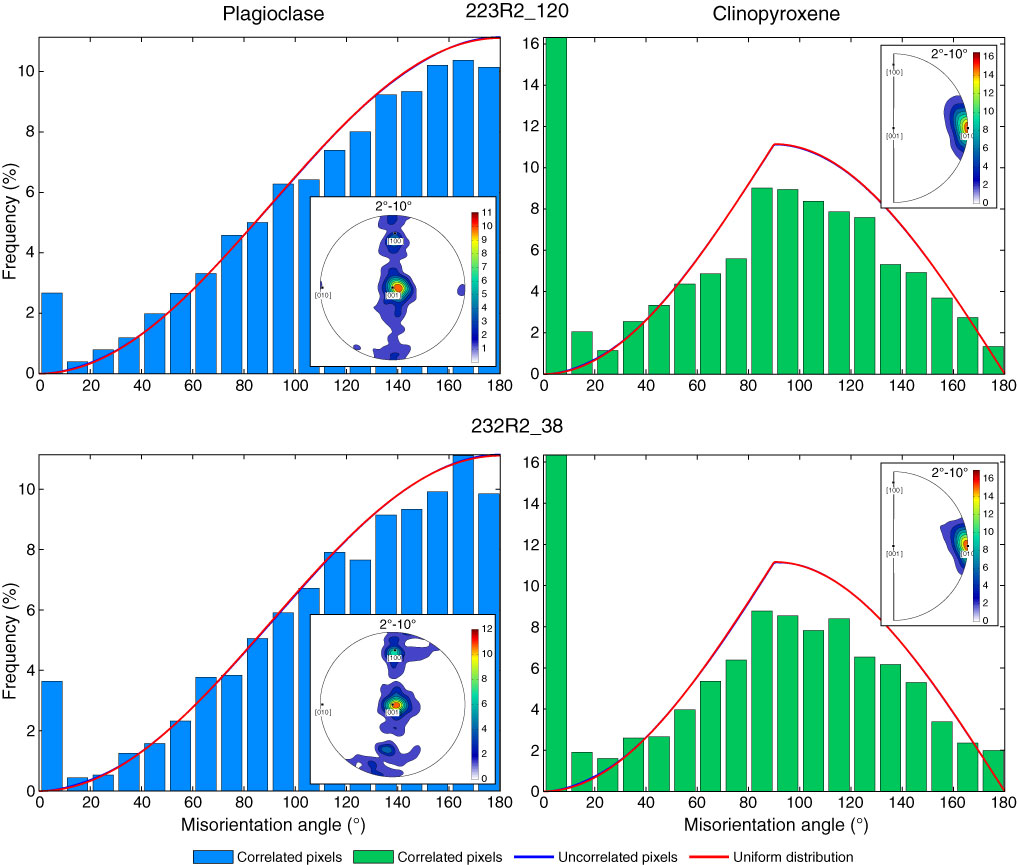
Figure F5. Misorientation distribution for Samples 312-U1256D-223R-2, 120–122 cm, and 232R-2, 38–40 cm. Inverse pole figures show preferred orientation of rotation axes corresponding to misorientations between 2° and 10°.

Previous | Close | Next | Top of page