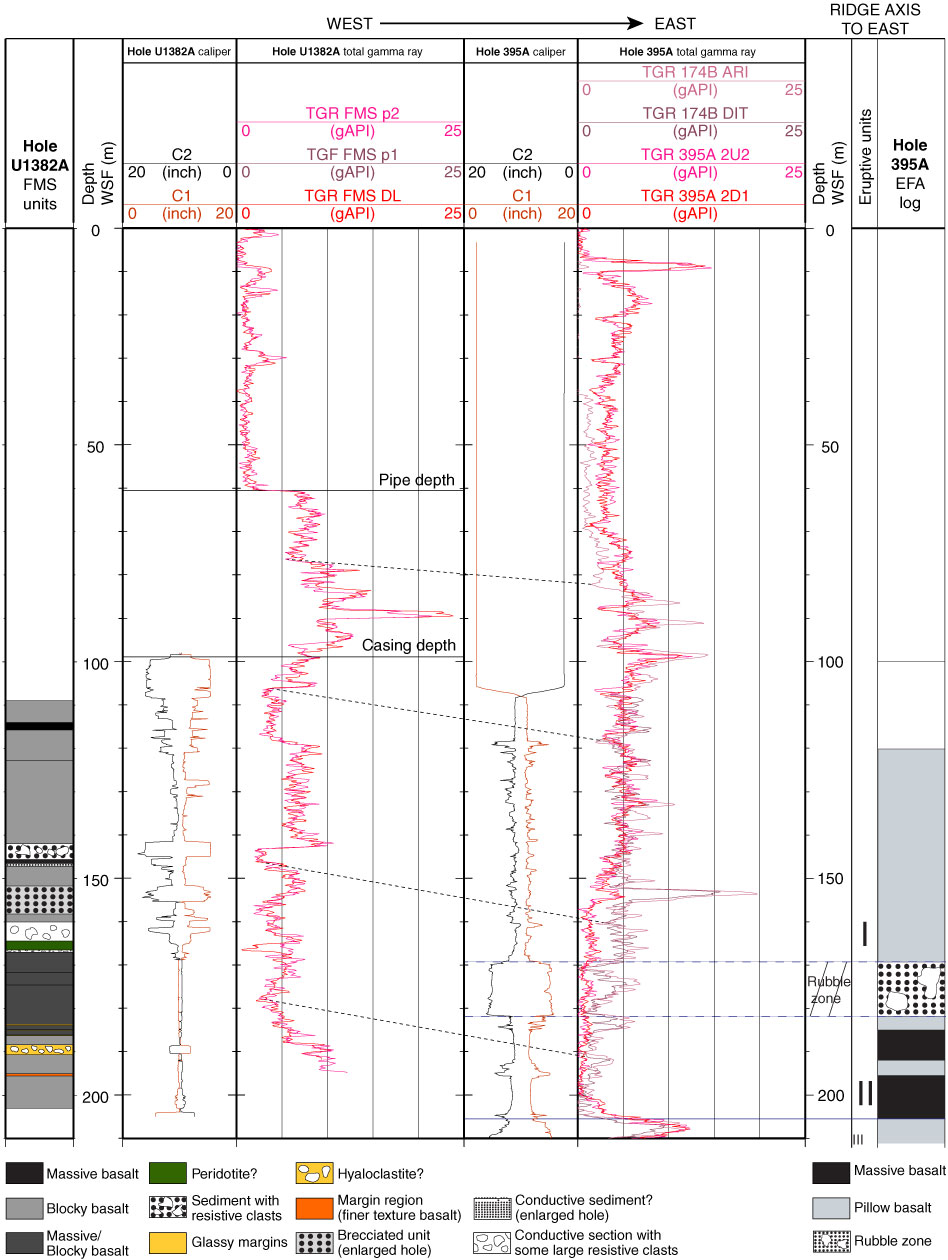
Figure F43. Comparison of total gamma ray (TGR), Holes U1382A and 395A. Measurements include Hole U1382A borehole diameter (C1 and C2 from Formation MicroScanner [FMS] Pass 1), Hole U1382A TGR (FMS DL, FMS p1, and FMS p2 = FMS-HNGS downlog, Pass 1, and Pass 2, respectively), Hole 395A borehole diameter (C1 and C2 from FMS Pass 2 [Leg 174B]), Hole 395A TGR (174B ARI = from Azimuthal Resistivity Imager [Leg 174B]; 174B DIT = from Dual Induction Tool [Leg 174B]; 395A 2U2 = from microbiology combo Run 2, Uplog 2 [Expedition 336]; 395A 2D1 = from microbiology combo Run 2, Downlog 1 [Expedition 336]). At far right is the electrofacies (EFA) log for Hole 395A (after Bartetzko et al., 2001) and units defined for Hole U1382A using FMS electrical images. Dashed lines = correlation lines between main features in TGR curves. Note that gamma ray from Hole U1382A has been correlated to open-hole gamma ray data collected during Leg 174B.
Previous | Close | Next | Top of page