Previous | Close | Next
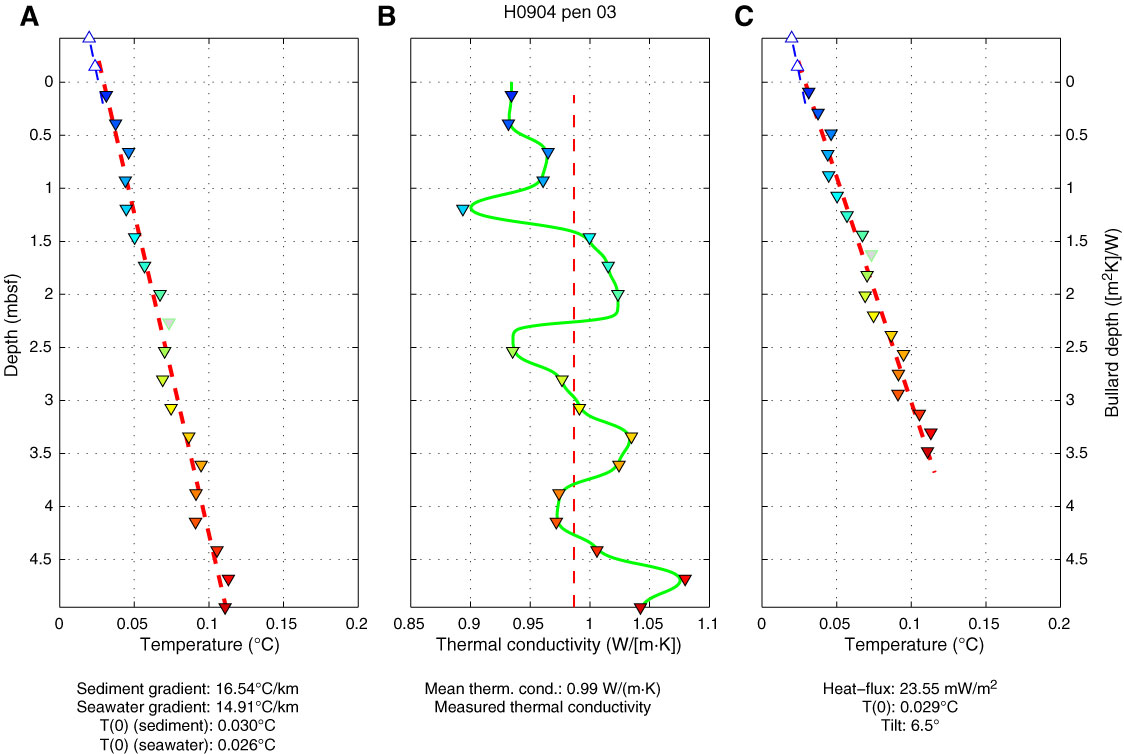
Figure F8. Example of a heat flow measurement result. A. Thermal gradient with depth. B. Thermal conductivity vs. depth. C. Bullard plot (Bullard, 1954); temperature vs. thermal resistance.
Previous | Close | Next | Top of page