Previous | Close | Next
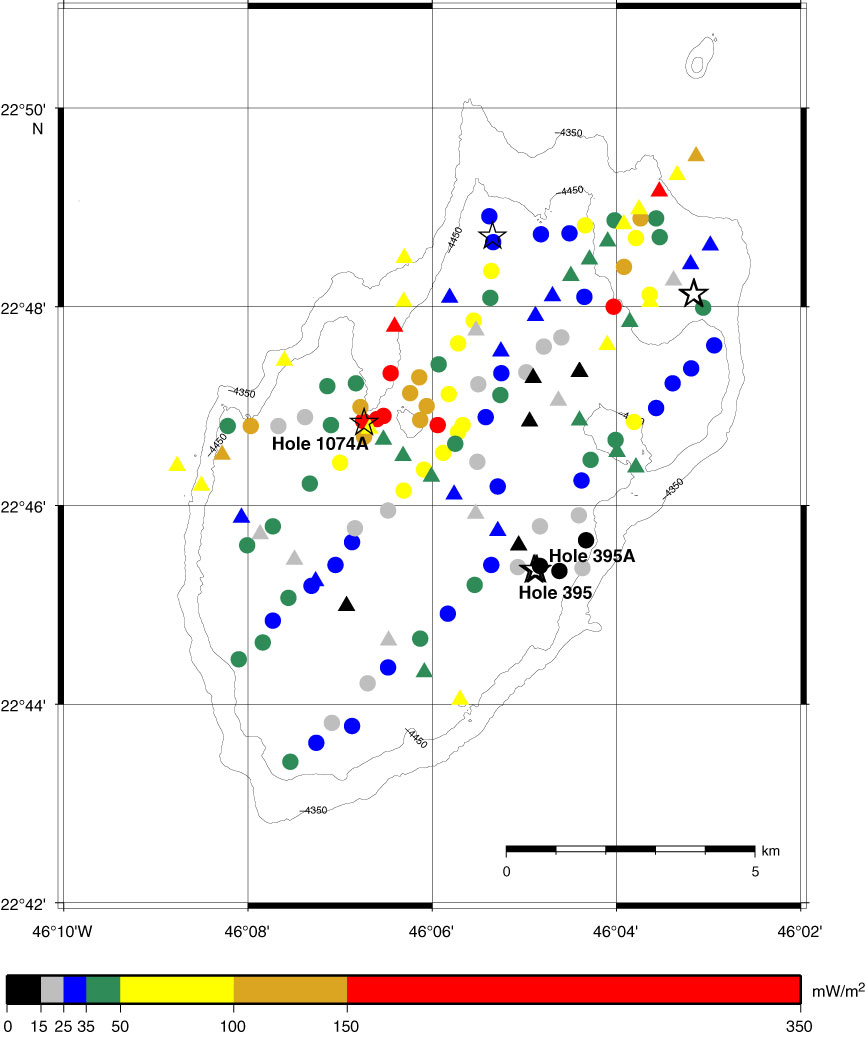
Figure F9. Map showing heat flow values from Langseth et al. (1992) (circles) and Cruise MSM 11/1 (triangles). Color coding is based on heat flow value. Stars = DSDP, ODP, and IODP sites.
Previous | Close | Next | Top of page