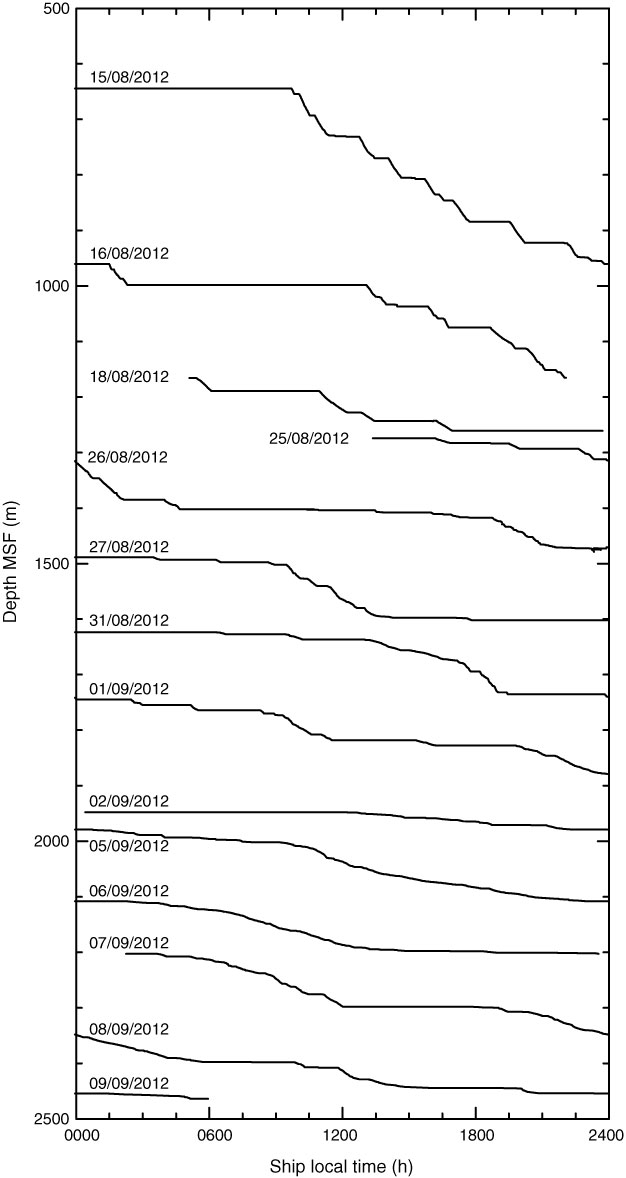
Figure F34. Diagram of depth of the incoming mud gas below the seafloor versus date and time of its arrival in the mud-gas monitoring van, Hole C0020A. The progression of drilling into the formation allows all days to be displayed on a 24 h scale in one panel. During mud-gas monitoring, all data were recorded in ship local time (UTC + 8 h).
Previous | Close | Next | Top of page