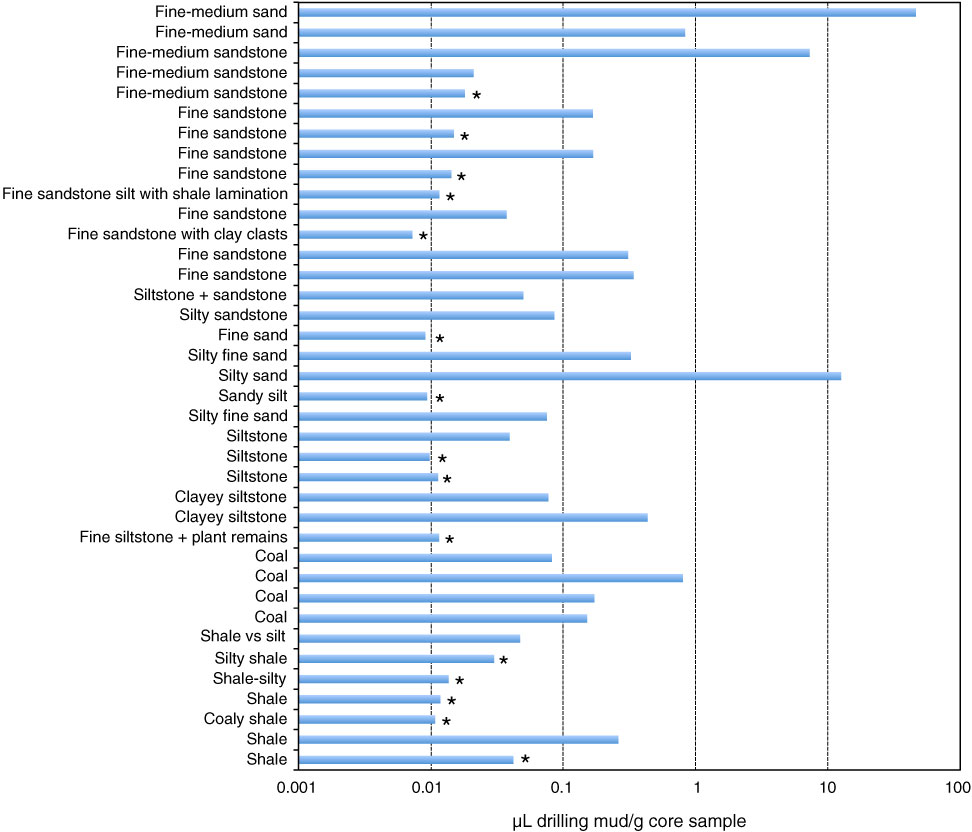
Figure F59. Drilling mud contamination of core interiors (µL drilling mud per g sample from core interior) across different lithologies, Hole C0020A. Data from the entire coring interval were included and organized by lithology. For samples where PFC was below detection (marked by *), we show the estimated maximum drilling mud contamination; as for Figure F58, this was calculated assuming the analytical detection limit of 8 × 10–12 g (8 pg) as PFC value within the GC-ECD injection volume (0.5 cm3), a PFC concentration in drilling mud of 100 µg/mL, and the amount of sample (g) taken for PFC analyses. Because the analytical detection limit and assumed PFC concentration were constant, the variation in calculated maximum estimates is solely due to differences in the amount of sample (g) used between samples. These considerable variations were caused by (1) inaccuracies in eye-based estimates of sample volumes (our target sample volume was 5 cm3), (2) variability in sample bulk densities, and (3) failure to obtain target sample volumes from hard samples (e.g., shales) within the short processing times that were necessary to minimize PFC loss to volatilization.
Previous | Close | Next | Top of page