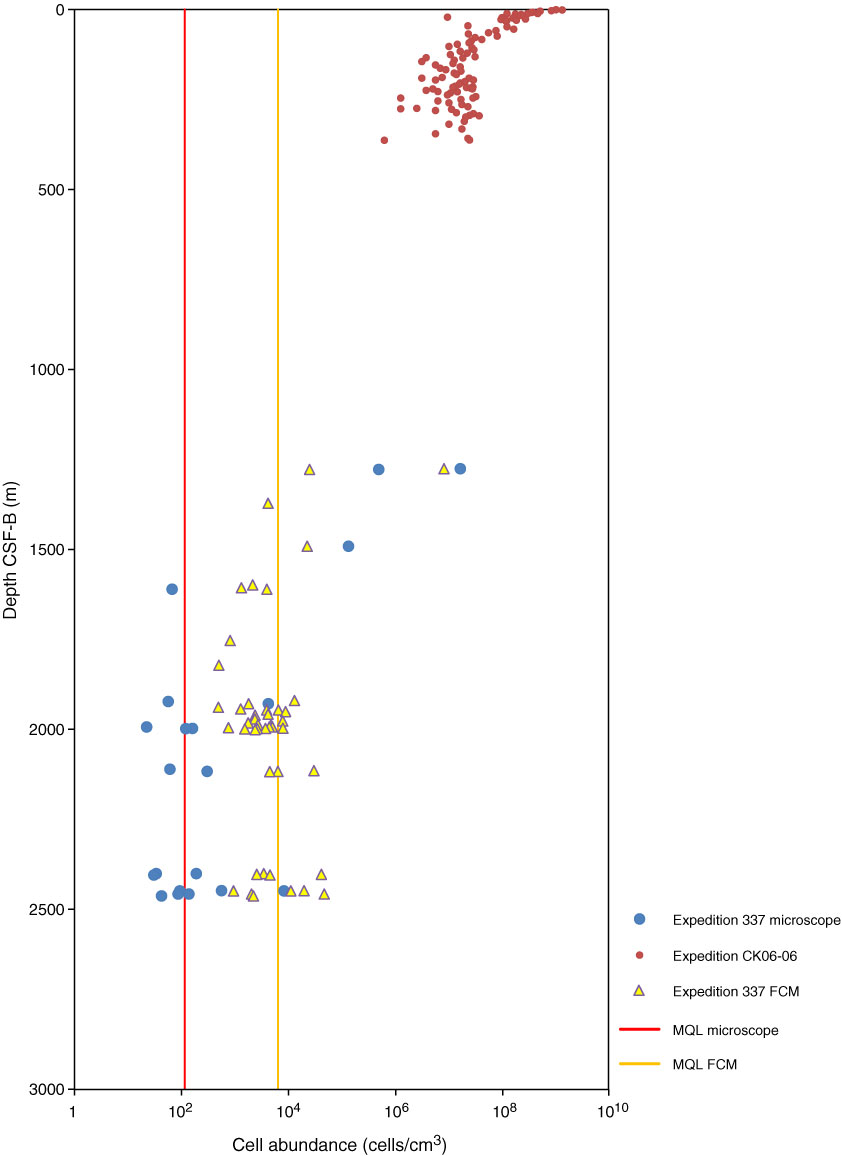
Figure F60. Microbial cell abundance in core samples at Site C0020 quantified by microscopic counts and flow cytometry (FCM). The minimum quantification limit (MQL) of each quantification method is shown as a line for both of the measurements.
Previous | Close | Next | Top of page