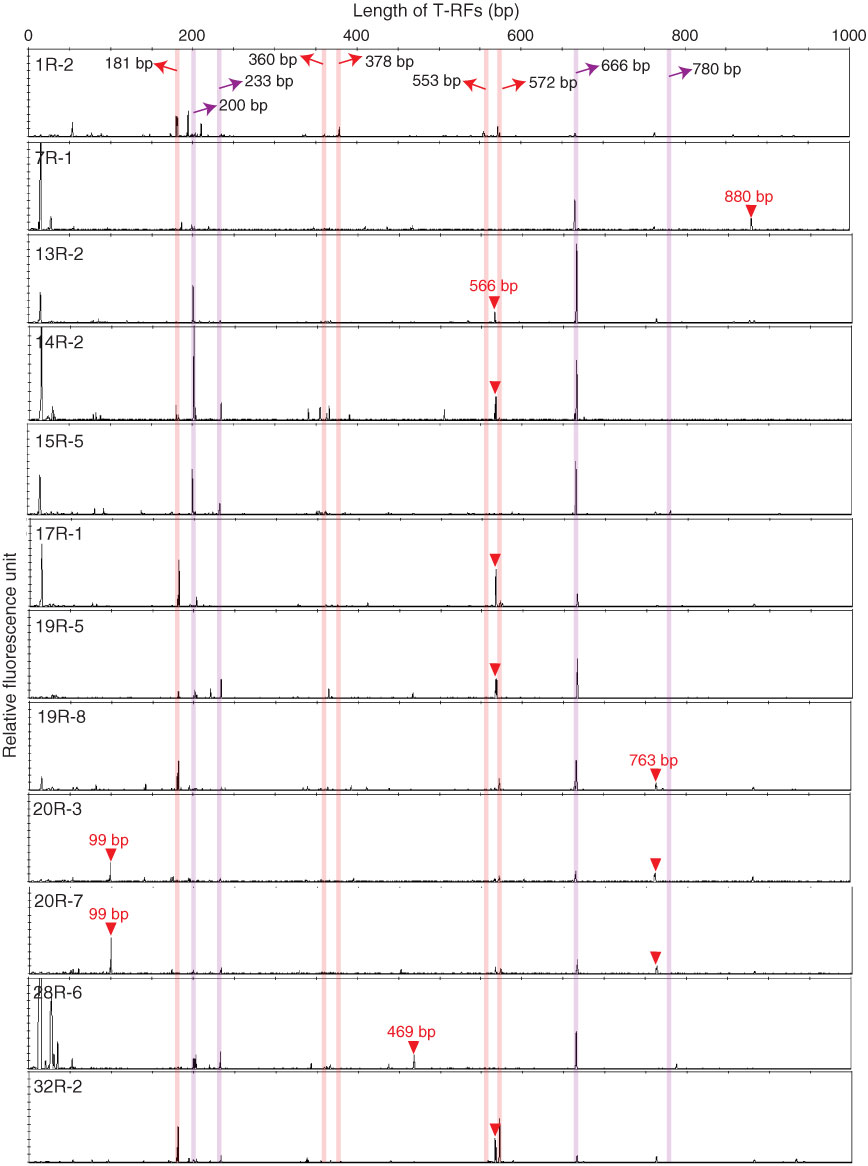
Figure F64. T-RFLP profiles of core samples, Hole C0020A. Orange lines = peaks common through the drilling period, purple lines = peaks from negative controls for the DNA extraction and PCR. Red triangles with the length of terminal restriction fragments (T-RFs) = peaks that only appear from the core sample. The x-axis maximum of each panel is 12,000 relative fluorescence units; bp = base pairs (for exact sample info, see MBIO_SAMPLE_LIST.XLSX in MBIO in “Supplementary material”).
Previous | Close | Next | Top of page