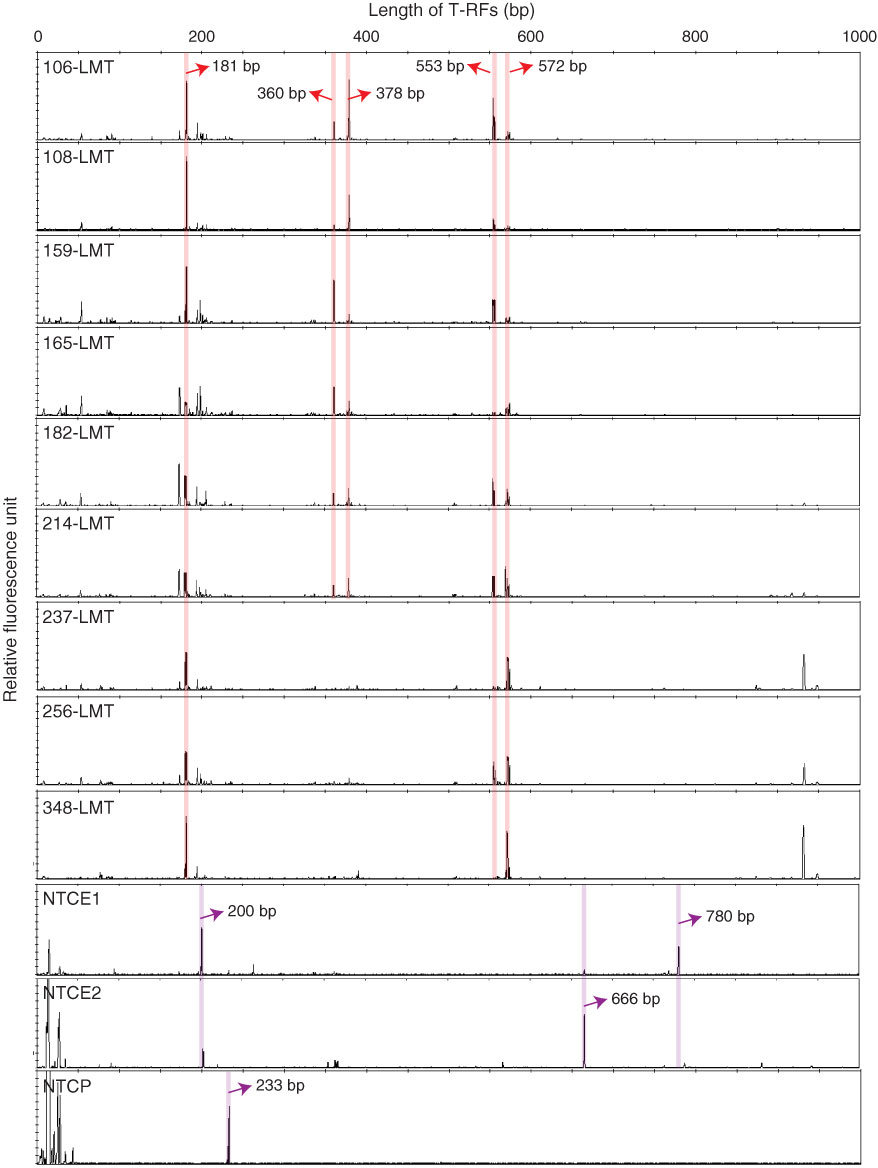
Figure F63. T-RFLP profiles of drilling mud and negative controls for DNA extraction and PCR, Expedition 337. Orange lines = peaks common throughout the drilling period, purple lines = peaks from negative controls for the DNA extraction and PCR. The y-axis maximum of each panel is 6000 relative fluorescence units, x-axis unit bp = base pairs. LMT = fresh mud water, T-RFs = terminal restriction fragments, NTCE = negative control for DNA extraction, NTCP = negative control for PCR (for exact sample info, see MBIO_SAMPLE_LIST.XLSX in MBIO in “Supplementary material”).
Previous | Close | Next | Top of page